Vegetation Health on the Gila River
In 2004, the Akimel O’otham and Tohono O’odham tribes won a water rights settlement in the US Supreme Court. However, despite this historic win for tribal sovereignty, and the protection of important social, cultural and environmental ways, the return of water rights has unfortunately not lead to an improvement in vegetation health. In a previous exercise I explored the mean NDVI differences between the Gila boundary and the areas outside of it during the month of July between 2001-2022. I will recap that below before we explore some other data to see if in fact the Gila river basin is not improving.
Learn more about the Gila River Indian Community here
You can check out the code for the precipitation analysis here
Mean July NDVI Inside vs. Outside Gila (2001-2022)
The first thing to notice is that for all the NDVI mean values, regardless of if they are inside or outside Gila, are positive in July. This indicates that peak-season vegetation greenness is reliably present across the region. However, the magnitude of July NDVI differs substantially between the two areas. Second, across the entire 2001–2022 period, the outside Gila region displays higher mean July NDVI than the inside Gila region. The outside area generally ranges from approximately 0.21 to 0.26, showing moderate but stable July greenness. In contrast, NDVI values inside Gila remain consistently below even the lowest values observed outside the boundary (with the only exception being 2005 where inside Gila has a mean July NVDI of almost 0.24).
Mean July NDVI difference (Gila v. outside, 2001-2022)
For each year, every NDVI value is the (Mean July NDVI inside Gila) minus (Mean July NDVI outside Gila). Essentially what this graph lets us answer is within each given year from 2001 to 2022, how much greener was the inside of the Gila boundary to its surroundings? The short answer is that inside Gila was never greener than outside (just like we see in plot 1).
The long answer: You will notice immediately that in comparison to the first plot, this line starts BELOW 0 and never crosses 0, and it is always a negative NDVI value. However, unlike the first plot, this negative NDVI value goes from about -0.05 in 2001 to -0.02 in 2022. So we are getting closer to 0, which means the greenness within the Gila boundary is becoming SIMILARLY green to its surroundings.
This narrowing gap may suggest a few things, and also should cause us to think about other contributing factors (and counterfactuals):
- That vegetation conditions inside Gila are in fact improving.
- There may be shifts in land use or management contributing to this improvement (OR) the returning of water rights made their burden on the environment less.
- There are other changing external conditions related to complex factors, like climate change, that may actually be affecting the areas outside Gila more NEGATIVELY leading to the narrowing.
- Most complex reason could be that between the two areas that there is increasing environmental similarity.
In all of these possible scenarios or reasons for the narrowing gap, it is obvious that we do not have enough data to conclude whether this narrowing gap is due to water rights or not. However, the plot does clearly show a long-term narrowing of the vegetation greenness gap between the inside and outside of the Gila boundary in July.
So how can we move beyond the limitations of NDVI data?
Given what we know so far, even after the 2004 water rights settlement, there are slow but positive change in mean summer NDVI within the Gila boundary. This suggests that, at least for July greenness, the vegetation response did not show a dramatic or immediate increase even nearly two decades after this policy change.
But we could track other potential positive indicators of the 2004 water rights settlement. So let’s:
- Take our Gila boundary (7 districts) and create a 2001-2022 land cover difference map to see if we have more or less vegetation in this time period. a. What this allows us to do: given the effects of climate change, NDVI may not be a reliable measure for seeing the environmental effects of returned water rights. This area is very hot, and also suffers from drought. Looking at total land cover change lets us better see whether there is a “green” expansion
- Look up the nearest Gila NOAA Station to pull precipitation data (2001-2022), to see if potentially there has been less rain in this period which is stressing out our vegetation.
Tracking precipitation
Since NDVI data is not accessible, lets consider the precipitation question. Unfortunately, NOAA does not have a station to record precipitation at the center of the reservation. However, we can use a close zip code (Laveen, AZ 85339 (Location ID: ZIP:85339). Laveen overlaps with the western half of the Gila boundary, and can still tell us whether the precipitation into the Gila basin in this area change a lot over this time period.
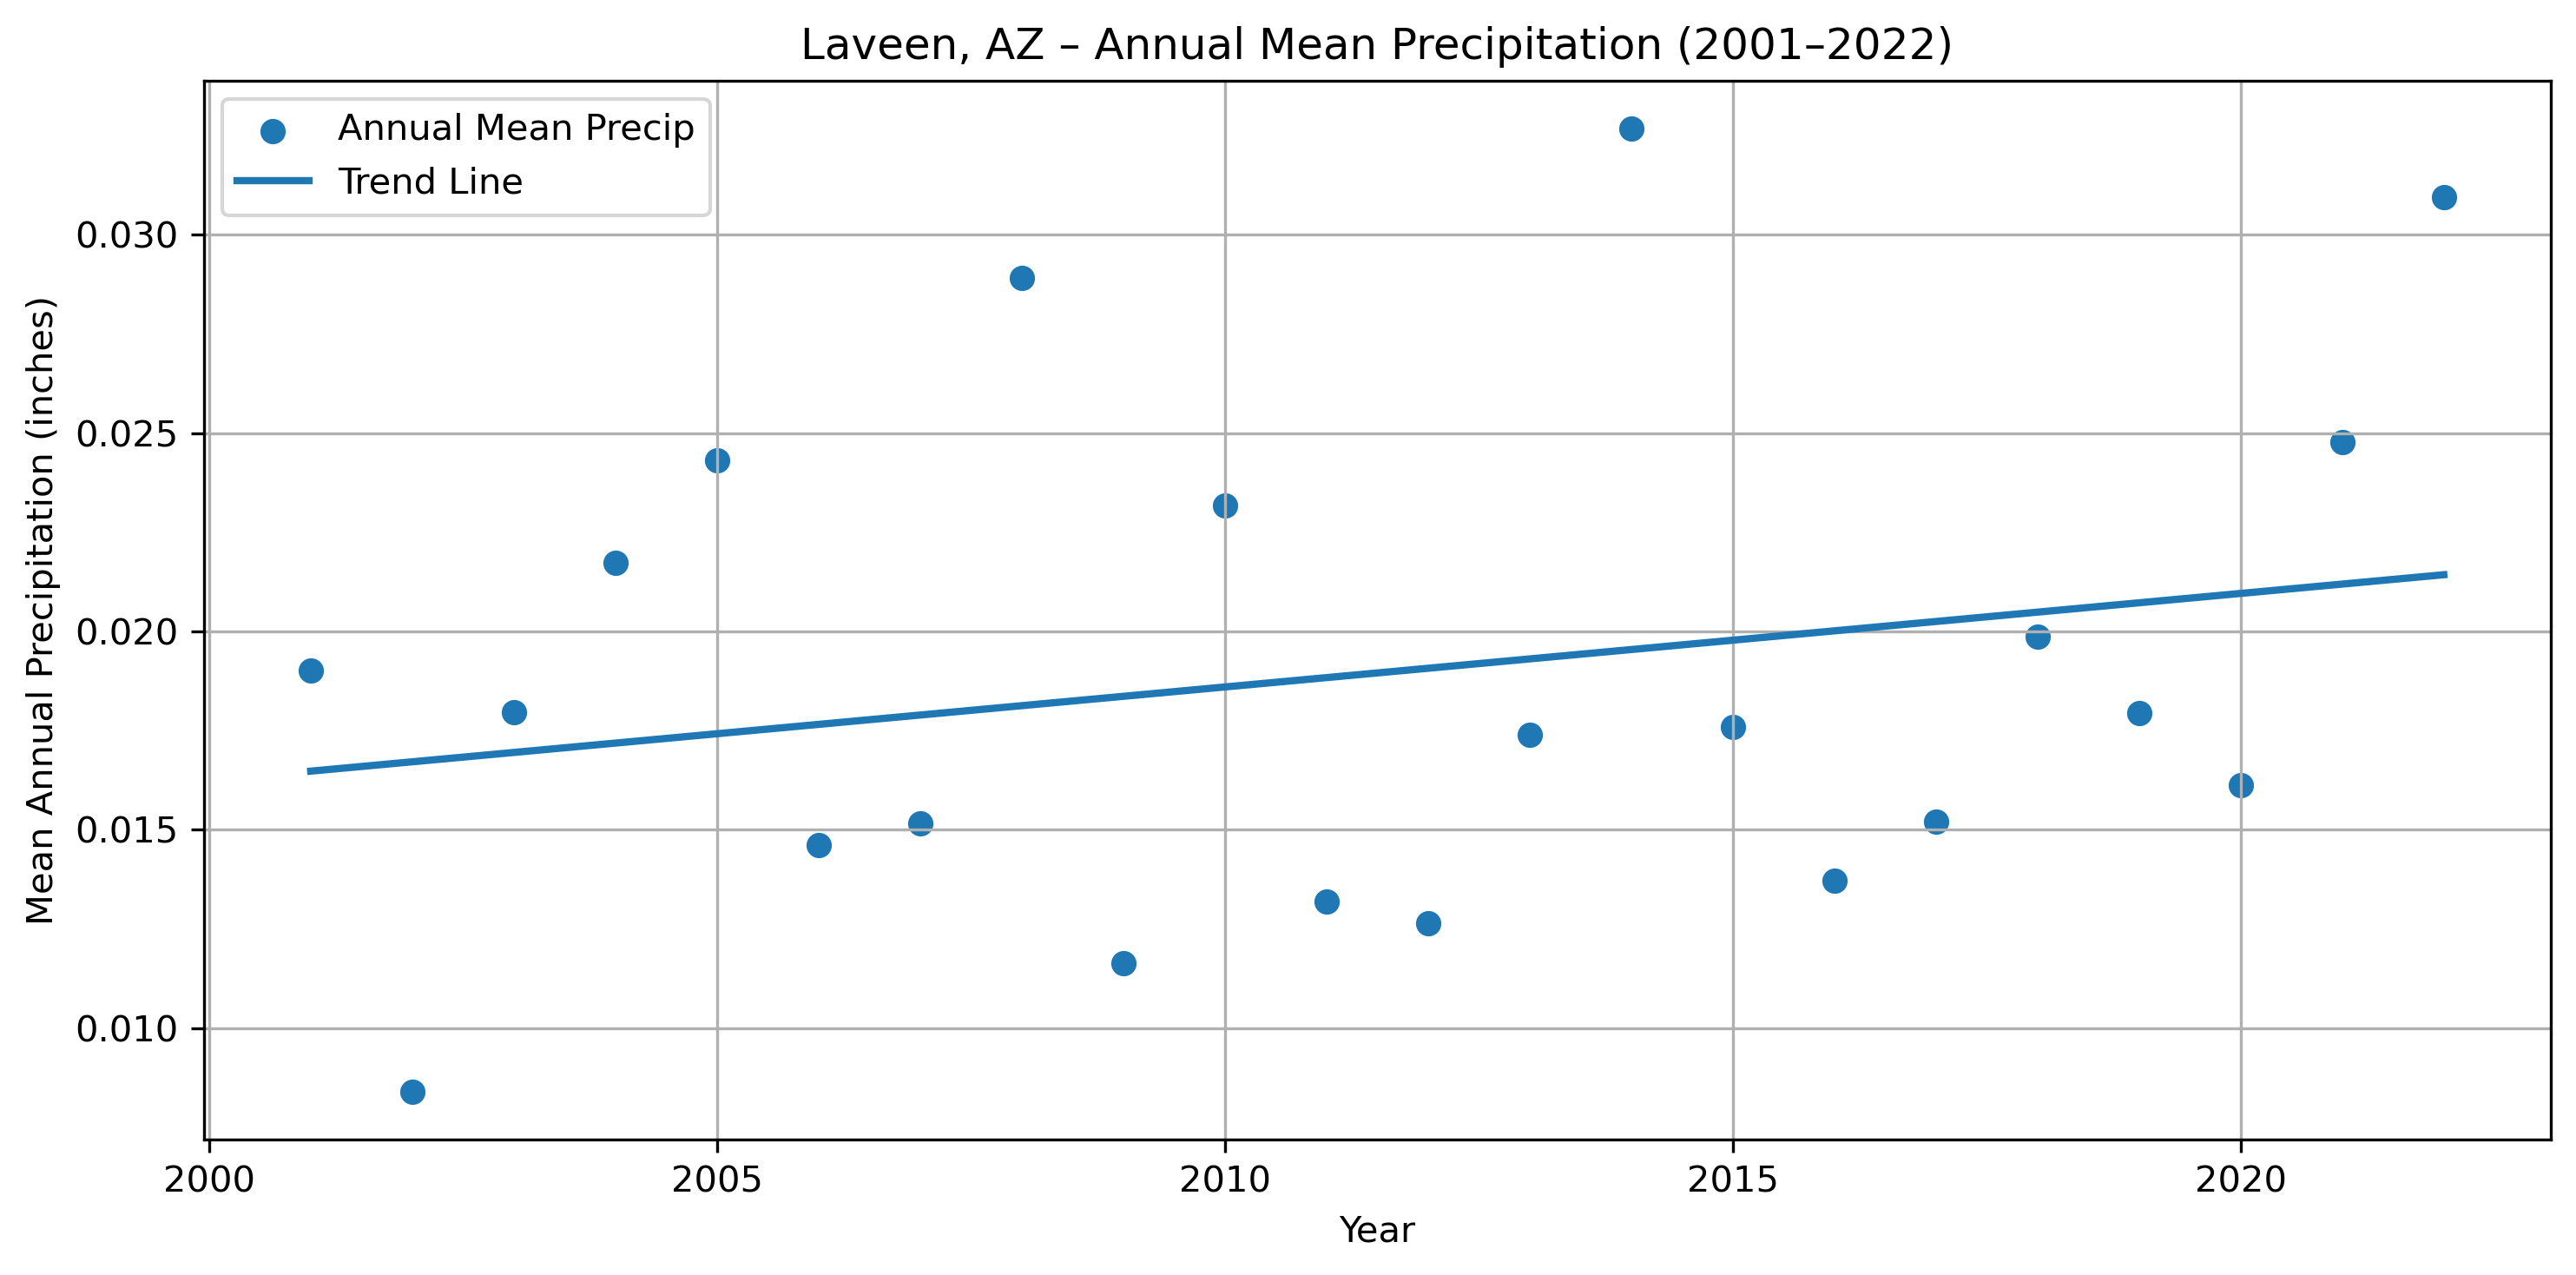
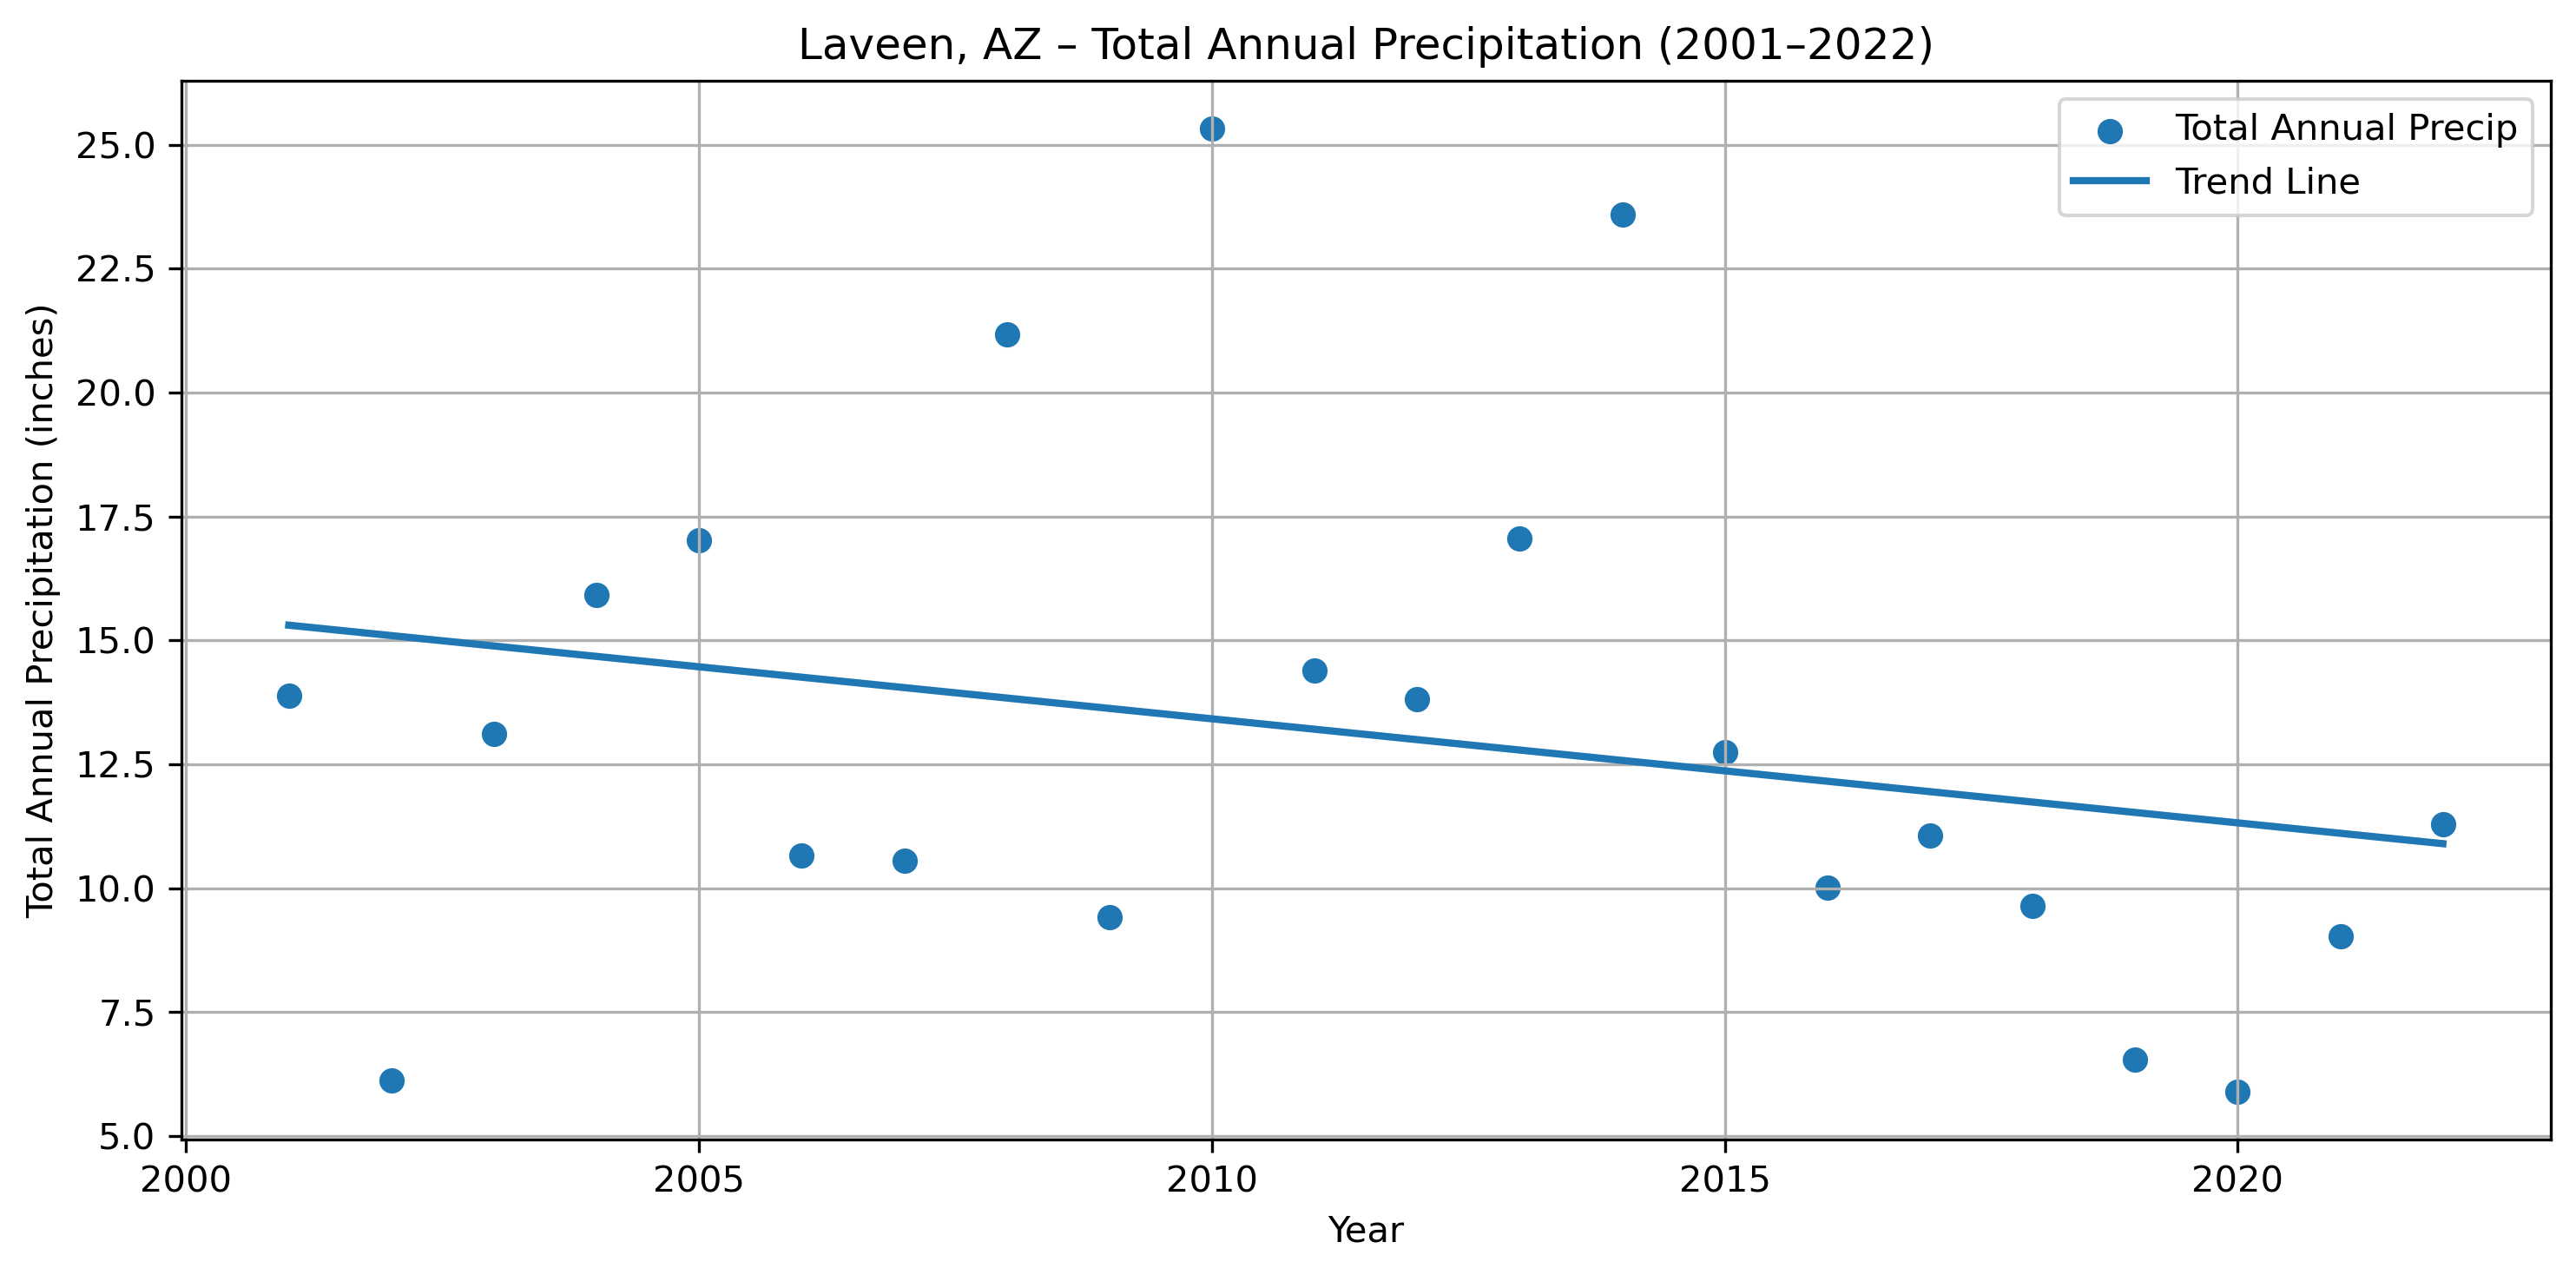
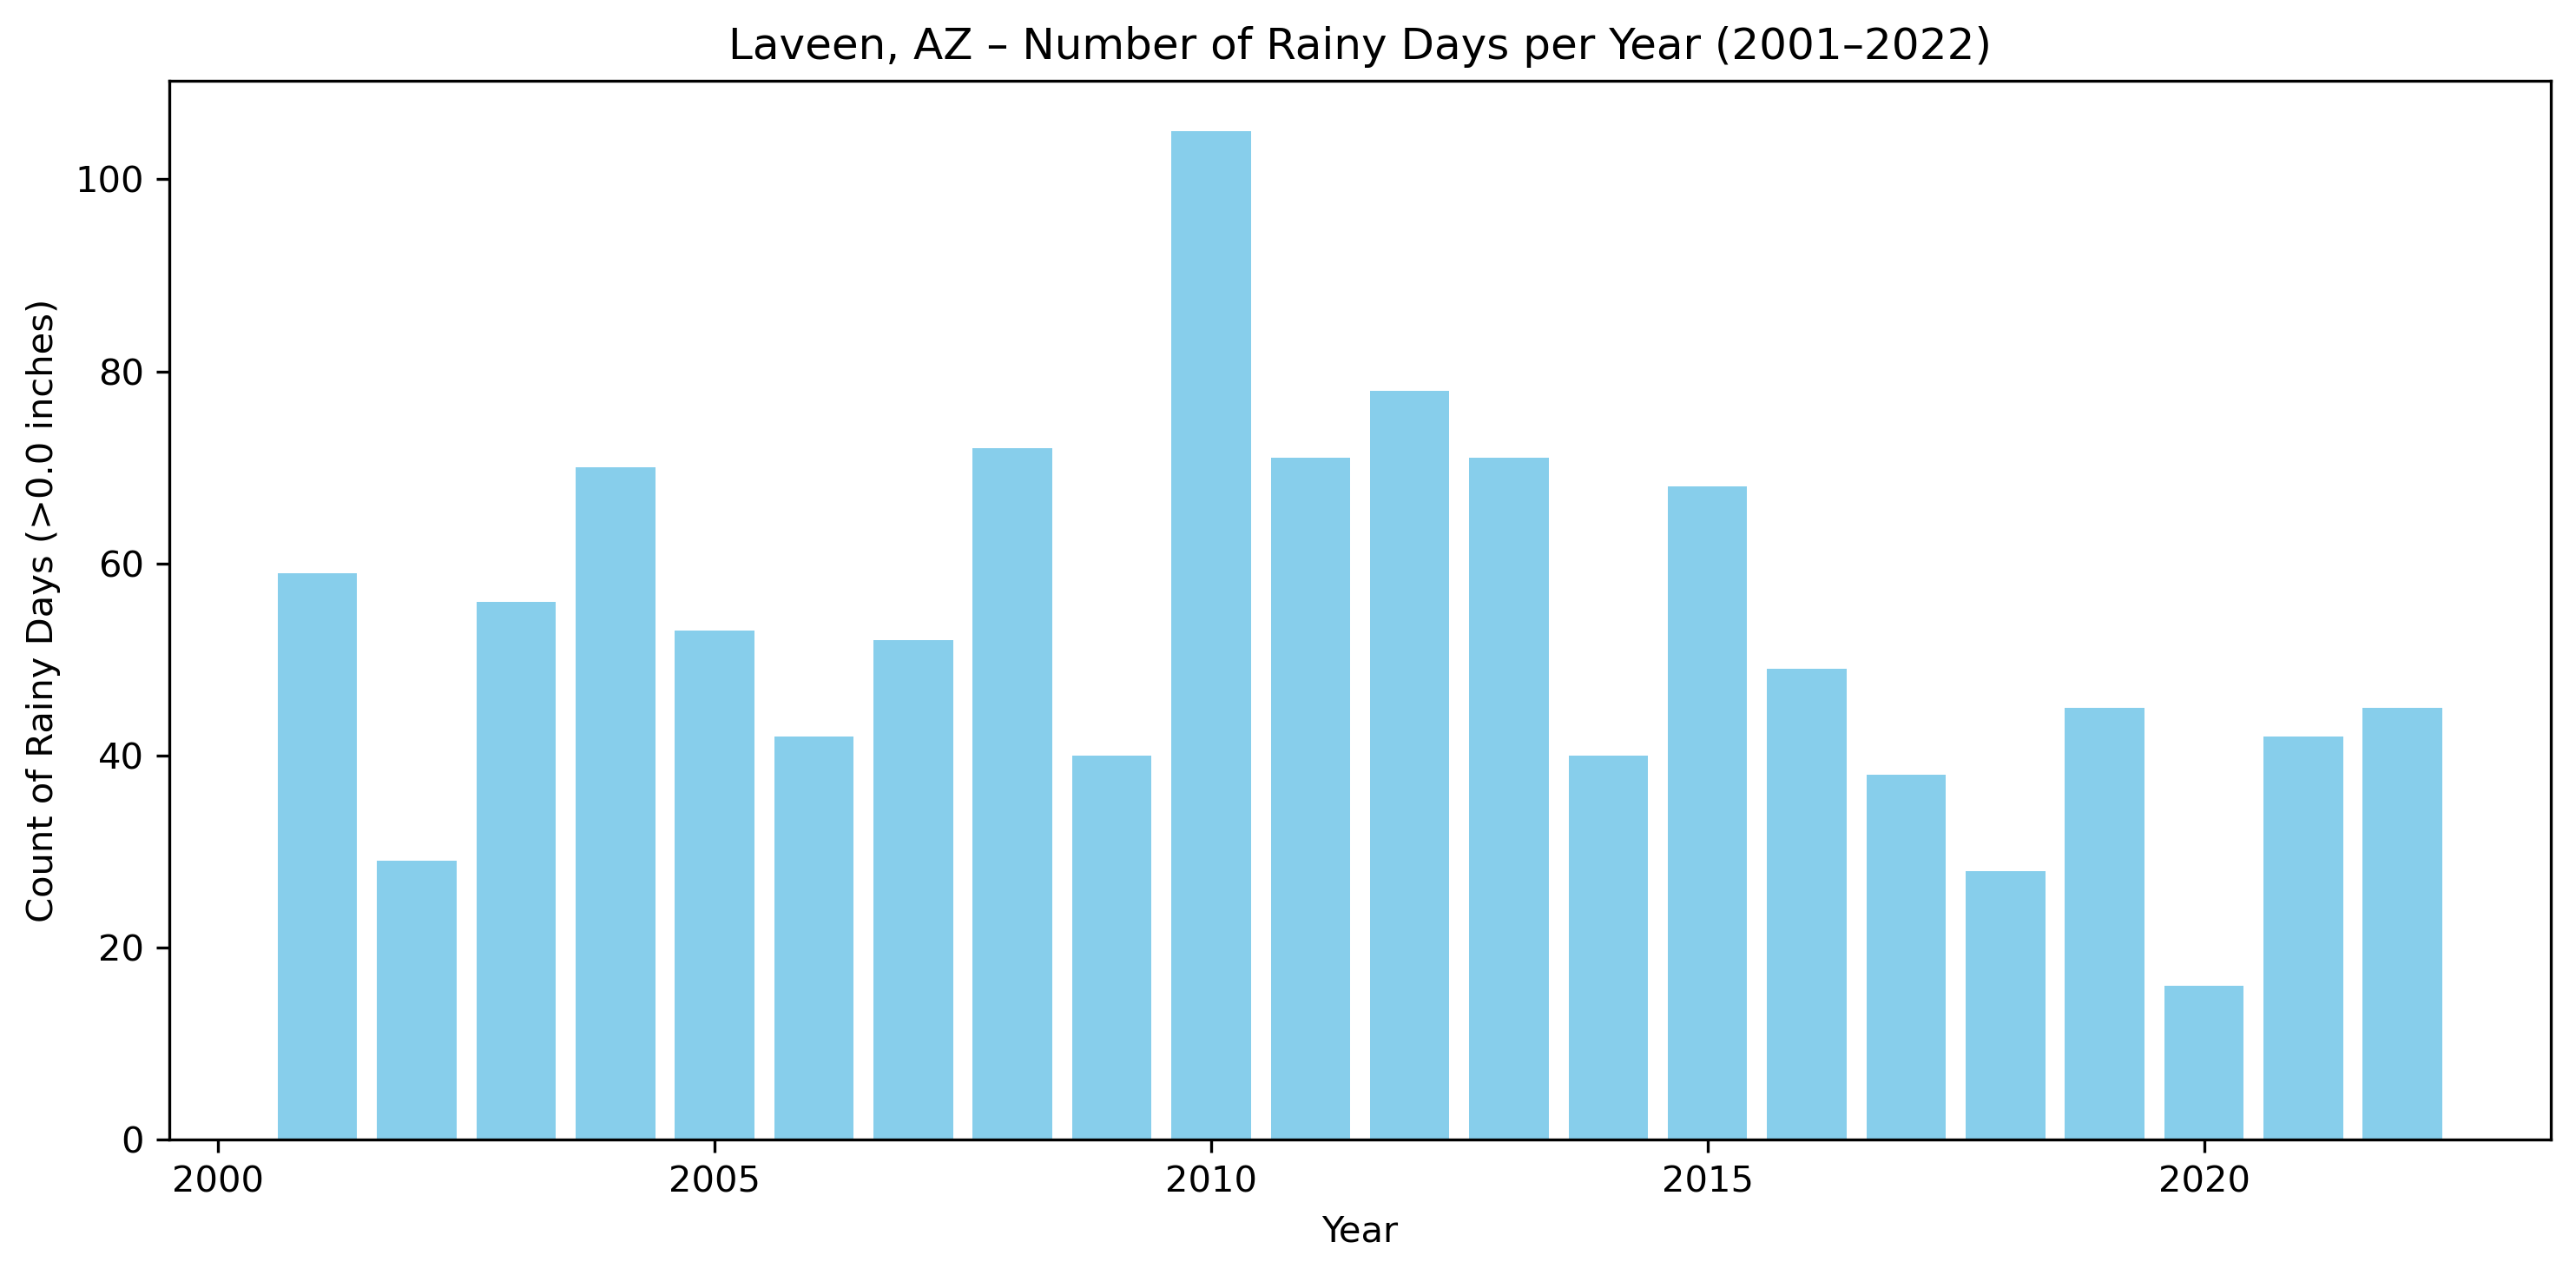
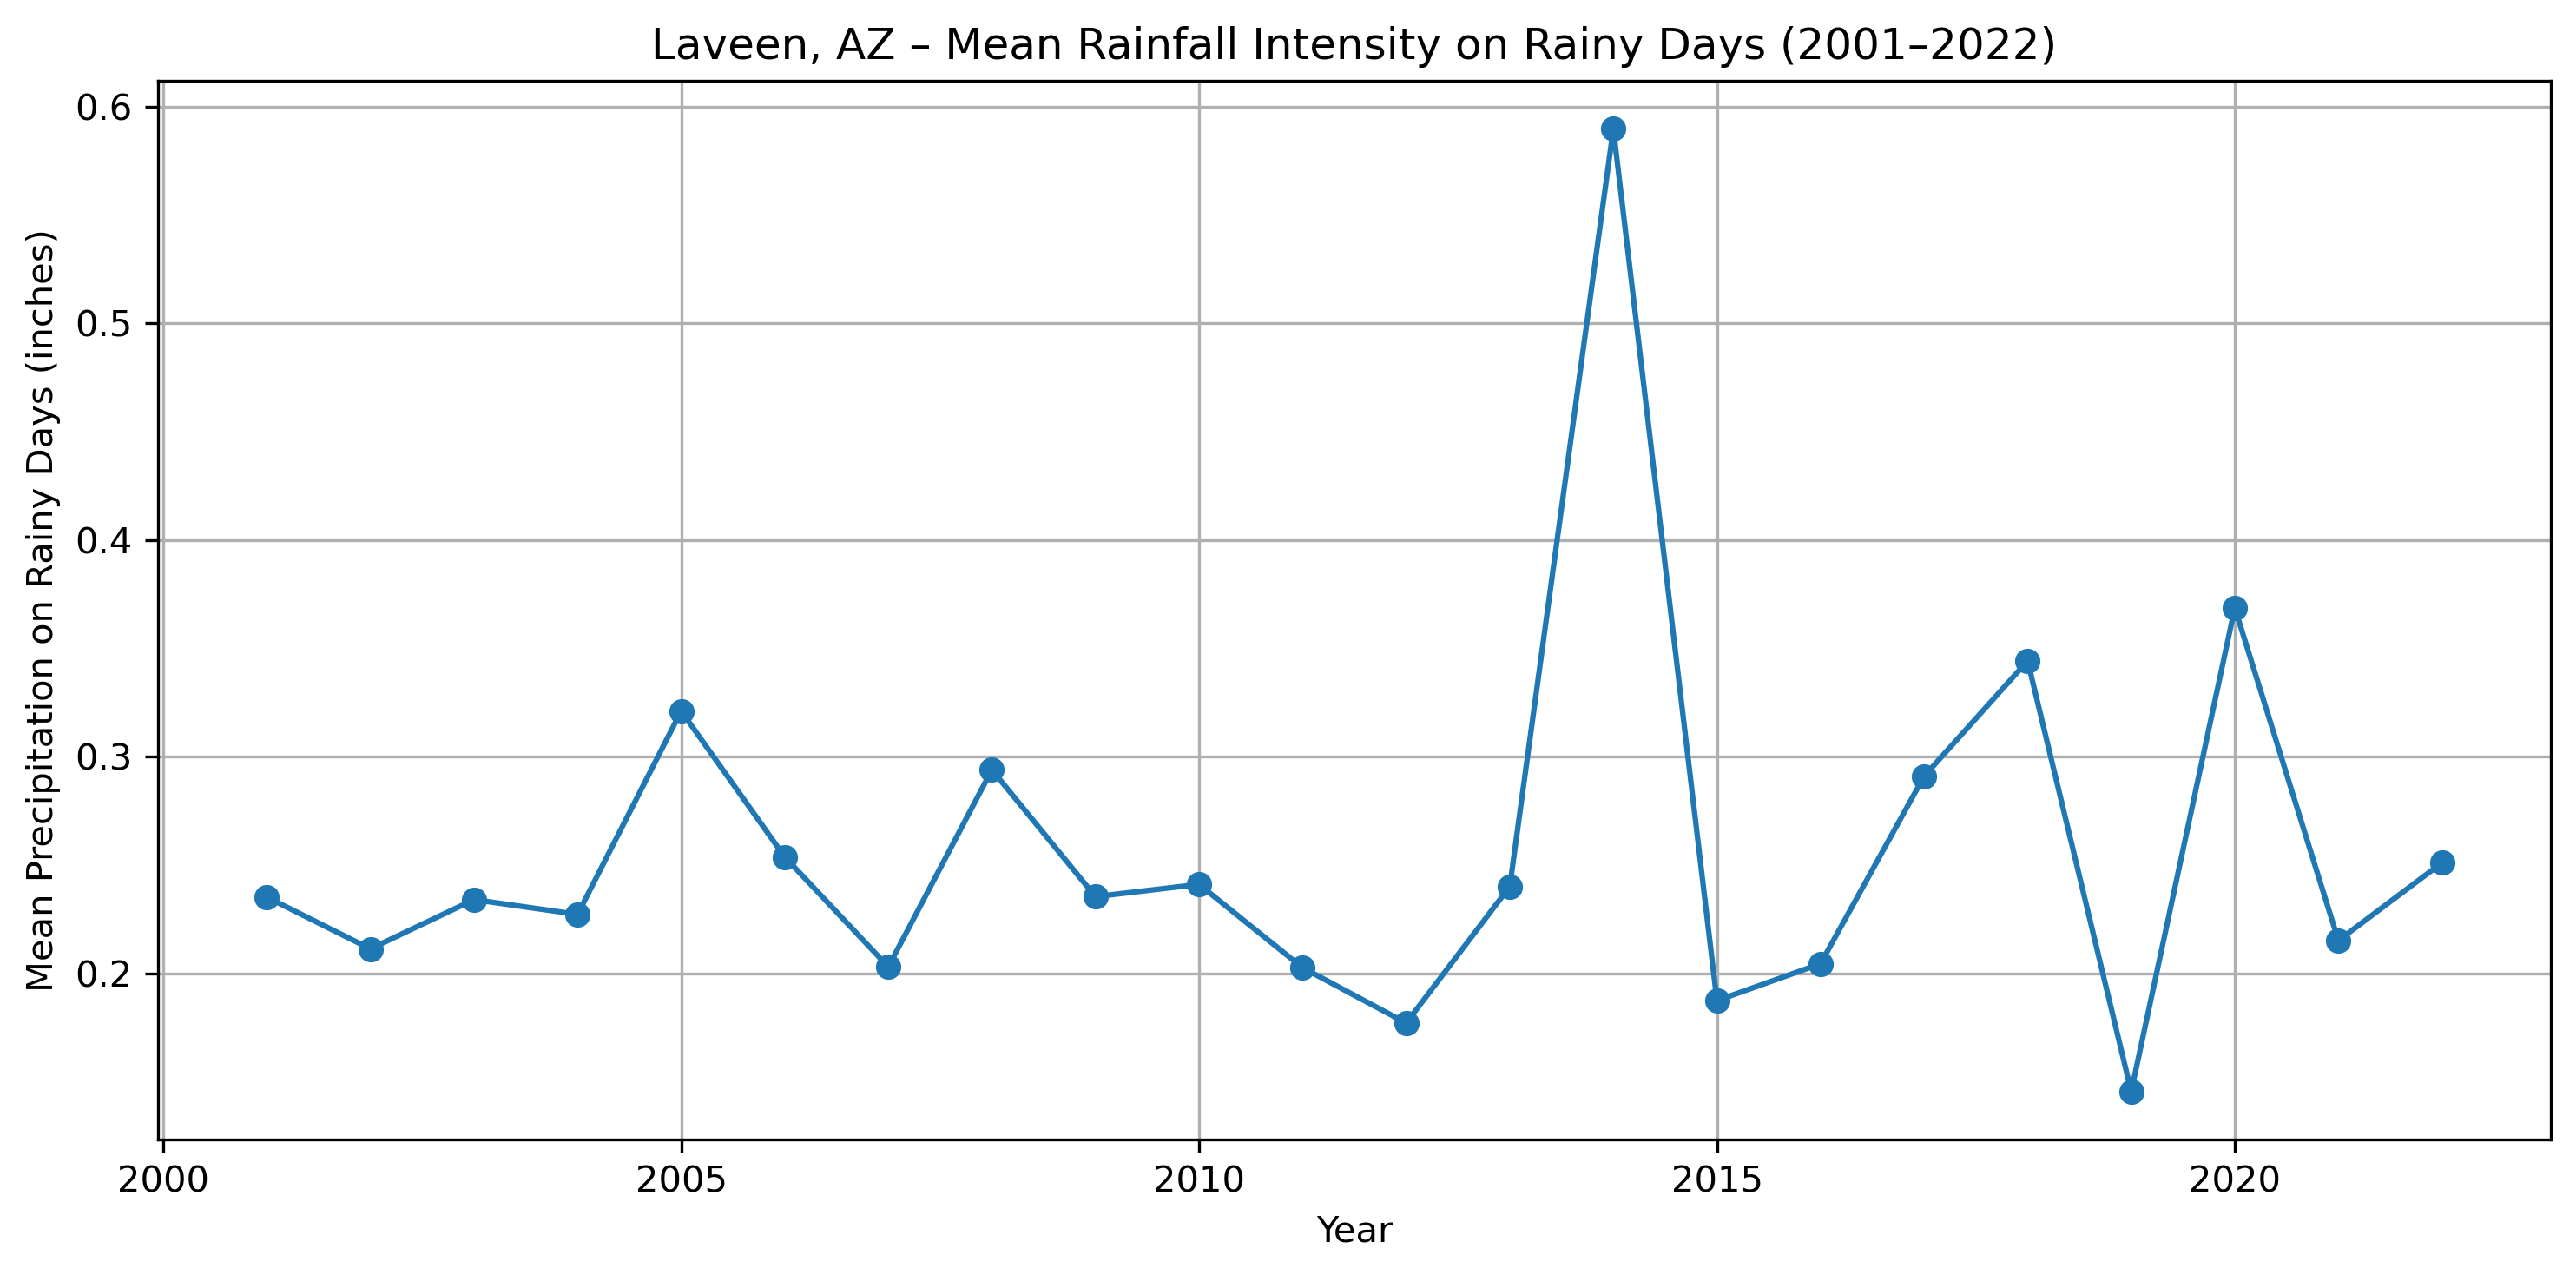
The specific station we are using is USC00025270. The precipitation csv provides daily totals of rainfall for the dates I called for (Jan 1, 2001 to December 31, 2022). Below I have created a trend graph of the annual mean precipitation, a trend graph of the total annual precipitation, and then calculations for the number of “rainy” days (precip > 0.0 inches) and “insanity” of rain on rainy days.
Interpretation of Rainy-Day Frequency and Rainfall Intensity (Laveen, AZ: 2001–2022)
The precipitation record for Laveen (which abuts and overlaps the Gila boundary) from 2001–2022 reveals an important pattern: the frequency of rainy days has declined, while the intensity of rainfall on days that do receive precipitation has remained variable and occasionally increased, though without a strong upward trend. These two shifts together help explain why the mean daily precipitation shows a very small positive slope, while total annual precipitation trends downward more strongly.
- Rainy-day frequency has declined sharply over time
Over the 22-year period, the number of days with measurable precipitation exhibits a somewhat downward pattern:
- Early 2000s: frequent rainy years (e.g., 59 rainy days in 2001, 70 in 2004, 72 in 2008, 105 in 2010).
- Mid-to-late 2010s and early 2020s: substantially fewer rainy days, including extremely dry years (28 rainy days in 2018, 16 in 2020).
- Rainfall intensity on rainy days is highly variable but not strongly increasing
The mean precipitation per rainy day (intensity) fluctuates considerably from year to year. Typical rainy-day intensities cluster around 0.20–0.30 inches. Some years show notably high intensities (0.59 in 2014, 0.37 in 2020, 0.34 in 2018), indicating substantial winter storms. Several years in the 2010s show much lower intensities (0.17–0.20 inches).
Overall, the intensity trend is flat to slightly increasing, but the variability is too large to indicate a clear direction.
-
Together, these patterns explain the mean vs. total precipitation trends Mean daily precipitation includes all 365 days, many of which have zero rainfall. A slight rise in event intensity—even with fewer rainy days—can nudge the mean upward. Total annual precipitation is driven almost entirely by the number of rainy days. With rainy-day counts falling from around 60–100 per year early on to 16–45 per year recently, totals drop sharply even if intensity remains stable or rises occasionally. This produces the stronger negative slope in total precipitation.
-
In short:
- Rainy days: clearly decreasing → drives down annual totals
- Rainfall intensity: variable, occasionally high, but no strong trend
- Mean precipitation: slightly positive because intensity on rainy days can rise even while rainy days decrease
- Total precipitation: stronger negative trend because fewer events mean fewer opportunities for accumulation
Coming back to Gila
Considering that the gap is narrowing between Gila and outside areas in terms of mean NDVI, and that rainfall has actually slightly declined during this period. One of our assumptions from earlier very well may be true. It may be the case that outside areas are getting worse compared to Gila. Essentially they are suffering more from the decline in rainfall than Gila is, now that Gila has their water rights back. Likely what we will see in the longer term, is Gila having a greater mean NVDI and crossing over 0.