The wonderful world of Timberdoodles (aka American Woodcock)

Some years ago when I was working in Boston a coworker of mine got me into birding. Birding is one of those hobbies that you do not do by half. One of my first sightings was an American Woodcock, also lovingly known as a Timberdoodle. They are also characterized by the males’ signature PEENT! call and their undulating strut. There has been a lot of speculation both by ornithologists (bird scientists) and birders as to why Timberdoodles do this. Beyond struting during their displays, some believe that this helps them coax worms out of the soil, while others contend it may be a way to confuse potential predators due to the movement. Regardless it is mesmerizing!
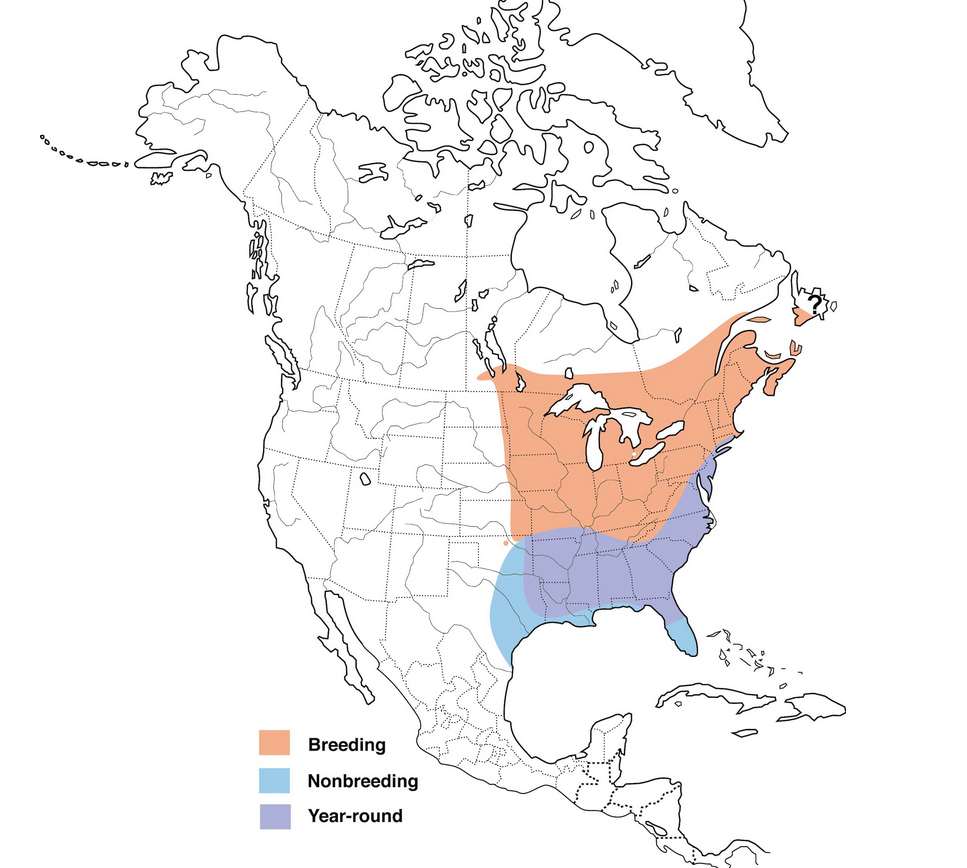
Timberdoodles love to move through leaf litter and primarily are found in the eastern half of the United States and are most active in March. As they are camouflaged well in the leaves they prefer wooded areas, or really anywhere they can hide in brush. What is most important to a Timberdoodle though is finding a nice field to do its flight displays at dusk for finding a potential mate. Of all the birds I have had the opportunity to observe, Timberdoodles have the most impressive display. They rocket up into the air by circling up to about 300 feet (where we unfortunately can’t really see them). When males do these displays their wings make a unique “tweeting” sound which helps draw the attention of potential mates. When the reach the top, it will sing, and then nearly free fall back down to the ground in a zig-zag pattern before quickly gliding to a stop. For this entire display they will start and stop in the same location. Males will continue this display for up to an hour at times.
If you would like to learn more about the American Woodcock, I highly recommend joining ebird to check out latest sightings of them, and to enjoy other videos and recordings of them. Unfortunately if you are in the western half of the United States, you will need to make a trip out east to see them. Check out ebird
If you have never heard what a male Timberdoodle’s call sounds like, hear a recording of their PEENT below:
See the famous Timberdoodle strut below:
Where do Timberdoodles go?
As mentioned before Timberdoodles almost never cross over the “middle” of the United States. This is one of things I lament about living in Colorado, because it is impossible to see these bird’s flight displays here. However, when they do somewhat cross the center line of the US, this happens during migration. They have two key migration periods. In the spring (March-May) they can move up the east coast into Canada and skim across Northern US states like Minnesota and Wisconsin. In the winter (September-November) they move back down south, but always staying to the eastern half of the United States.
Think! Think! Think!
Knowing this new information, I invite you to go back to the ebird link from earlier and look at the range map of sightings. Do you notice anything odd? That’s right, we have Timberdoodle sightings where they shouldn’t be! Most of these “sightings” are misidentifications, especially in the Southwest. How can we be sure these sightings are a mistake by too-enthusiatic birders? We can look at American Woodcocks that have been tracked by Cornell Lab. ebird is managed by the Cornell Lab of Ornithology. While the original link I gave you to explore links to the more public-friendly ebird page for American Woodcocks, going forward we will need to review Cornell Labs full report on our favorite bird.
Comparing what we know about migration
While I knew the lives of Timberdoodles from my birder co-worker (the amazing Dr. Kimberley Garrett!), here we can see more clearly that the migration paths of these birds do not match up with the range map of sightings on ebird. Let’s compare them side by side (or top to bottom depending on your screen size).
 You can view this image full size from Cornell Labs
 You can expand this map on the ebird page for the American Woodcock
You will notice that some of the range map sightings do line up with the migration flight maps from Cornell Labs. But let’s see this migration path in motion.
McAuley, D. G., D. M. Keppie, and R. M. Whiting Jr. (2020). American Woodcock (Scolopax minor), version 1.0. In Birds of the World (A. F. Poole, Editor). Cornell Lab of Ornithology, Ithaca, NY, USA. https://doi.org/10.2173/bow.amewoo.01
Migration in motion
We can use occurance data from the Global Biodiversity Information Facility (GBIF), for the American Woodcock or Scolopax minor (J.F.Gmelin, 1789). But why are we using GBIF and not just range data from eBird? eBird data is not vetted by outside sources where GBIF has a variety of controls and standardization practices which makes their data more reliable, applicable and accurate for our comparison.
For those of you interested, here is the longer more detailed reason why GBIF is better: GBIF provides a uniquely comprehensive and standardized repository of species‐occurrence data, drawing from thousands of sources including museum specimens, government surveys, research networks, environmental DNA projects, and citizen‐science platforms such as eBird. Unlike single-source systems, GBIF harmonizes all incoming records through Darwin Core metadata standards (i.e., standard file formats) and applies transparent, automated data-quality checks that flag issues in taxonomy, geolocation, duplication, temporal accuracy, and metadata completeness. This consistent validation, combined with integration into a global taxonomic backbone, allows users to trace records to their source and filter by quality metrics tailored to analytical needs. While eBird offers exceptionally high-resolution data for birds, GBIF provides broader taxonomic coverage, richer metadata, and a standardized quality-control framework that enhances interoperability and makes its occurrence data particularly suited for comparative, cross-taxa, and global ecological analyses. Learn even MORE about GBIF controls
We will use occurence data from 2022 to visualize migration patterns from January to November. Explore the slider below and see how this migration map compares to the eBird range map and the static migration path map from Cornell Labs.
Note
You may notice when you scroll your mouse over the map that you get a normalized occurence value (which is also what the legend of this map is referencing). Normalization is essential to letting us compae data from different samples or studies that may have varying sampling protocols or biases. This is because even though GBIF has many required vetting standards for what can and cannot be recorded as an “occurence,” some occurences are still more accurate than others. By normalizing we can compare the data from different samples or studies, or in this case, occurences of differing “quality.”
For our interactive map above this just means that in January-March we see a greater density of Timberdoodles along the east coast and through Appalachia (very light blue v. very dark blue). If you spend some time looking at values you will see that we have some normalized occurence values of 0.2 compared to 0.1 or even smaller. In this case an area with an value of 0.2 has twice the relative occurence (or traces or abundence) of American Woodcocks compared to areas with a value of 0.1.
Migration wrap-up
So what have we learned about Timberdoodles and their movements? First, if anyone tells you they saw one in California you can tell them they are mistaken. Second, it is important to compare a variety of sources when trying to understand any phenomenon. Looking across our three sources, we see that the GBIF plotted map and the Cornell Labs map line up pretty nicely. We can also see that spring and winter migration pattern discussed earlier where American Woodcocks can be sighted more north in the spring (see the March and April months in the map above), compared to the winter (see November in the map above).