Ramona Fire Recovery
Vegetation Change, Fire History, and Climate Trends in Cedar & Witch Fire Landscapes (2000–2024)
I have been building a geospatial analysis of long-term vegetation recovery in the Ramona, CA region, focusing on two major wildfires: the Cedar Fire (2003) and the Witch Fire (2007). Using a combination of RCMAP shrub cover data (1998–2024), NASA AppEEARS MODIS NDVI data, and high-resolution fire perimeter and buffer analyses, this project explores how vegetation structure and greenness recover inside fire scars compared to surrounding landscapes.
You can follow the methods for each piece of this project by clicking on the following html files for each notebook that was created to code this.
- Overview notebook html
- Ramona climate change notebook html
- Ramona fire perimeters notebook html
- Landcover notebooks 1, 2, 3 and 4 htmls (click each number for each notebook)
- NDVI recovery notebook html
You can also find the repository for this project at https://github.com/kward-alt/ramona-fire-recovery (please pardon my dust as that repository is fully built out with its associated readme, yml, and other files for replication).
Why Ramona?
Brief Social, Political, and Agricultural History of Ramona
Ramona is a rural community located in the backcountry of San Diego County. The region was originally inhabited by the Kumeyaay people and later became part of Spanish and Mexican land grants in the Santa Maria Valley. During the 1870s Gold Rush, Ramona served as a key stagecoach stop between San Diego and Julian.
After the Gold Rush, Ramona remained a quiet agricultural community. By the early 1900s, it earned national recognition as the “Turkey Capital of the World,” and ranching of poultry and cattle supported the local economy. In recent decades, zoning changes and population shifts have reduced agricultural activity. Despite these changes, Ramona continues to maintain a strong rural and community-oriented identity.
Citations: (Shipek, 1988; Pourade, 1965).
The Ramona Landscape, Geography, and Topography
Known as the Valley of the Sun, Ramona experiences hot summers, mild winters, and significant inland temperature variability. The town lies within a large valley surrounded by mountains ranging from ~1,000 to over 2,300 feet in elevation and is partially bordered by the Cuyamaca Mountains and the Cleveland National Forest.
Ramona is situated within the Southern California chaparral biome, dominated by drought-tolerant, fire-adapted shrubs. Shrubland is especially prominent along the rugged hills that border town, while oak stands occupy ravines and river corridors. The region is also characterized by rocky terrain, with Highways 67 and 78 carved directly into steep mountain faces.
Citations: (Keeley et al., 2004).
The 2000s “Ring of Fire”
Prior to the 2000s, Ramona had limited exposure to high-intensity wildfire events. This shifted dramatically in the early twenty-first century.
2003 Cedar Fire
- Burned over 200,000 acres—at the time, the largest fire in California history.
- Impacted regions east, southeast, and southwest of Ramona.
- Burned for more than a month under extreme weather conditions.
2007 Witch Creek Fire
- Ignited north of town and burned the entire northern corridor.
- Though smaller than the Cedar Fire, it significantly affected local vegetation and communities.
Together, these fires created a complete “ring” around Ramona. Residents frequently describe the 2000s as a defining decade shaped by fire and note that the landscape has not fully recovered—even nearly twenty years later.
Citations: CAL FIRE (Cedar Fire 2003; Witch Creek 2007).
Investigating the Ring of Fire
Residents are correct that wildfire dramatically alters the landscape, but quantifying these changes requires spatial and temporal analysis.
This project investigates climate patterns, vegetation health, and land-cover change in Ramona before and after the Cedar and Witch Creek Fires using temperature trends, NDVI time series, and shrubland cover datasets.
Assumptions and Hypotheses
A1. Climate Change Assumption
Ramona has experienced measurable climate change, consistent with both observational data and lived experiences.
- Tested by analyzing long-term temperature trends (TMAX, TMIN, TAVG).
H1. Vegetation Recovery Hypothesis
Vegetation in Ramona has not fully recovered from the 2003 Cedar and 2007 Witch Creek Fires.
H1.1 – Shrubland differences within vs. outside fire perimeters
Test through:
- Mapping fire boundaries.
- Analyzing RCMAP shrub cover for 1998–2010 and 2011–2024.
- Comparing land cover 3 years before and after each fire
(2000–2003–2006 for Cedar; 2004–2007–2010 for Witch).
H1.2 – NDVI differences within vs. outside fire perimeters
Test through:
- Using NASA AppEEARS MODIS NDVI (2000–2020).
- Comparing NDVI inside and outside fire perimeters for key pre- and post-fire years.
Datasets Used in This Project
For A1: Climate Trends
- NOAA NCEI Daily Temperature Data
Station: GHCND:USW00053120 (Ramona, CA)- Includes TAVG, TMIN, and TMAX from 1998–2025.
- Used to detect long-term warming trends.
(NOAA National Centers for Environmental Information, 2025).
For H1.1: Shrubland Cover Analysis
- California Census Designated Places (CDPs) – Boundary of Ramona.
- California Historic Fire Perimeters (1950–present) – Cedar (2003), Witch Creek (2007) boundaries.
- California Protected Areas Database (CPAD) 2025 – Local open-space geometry.
- MRLC/USGS RCMAP Time-Series Shrub Cover (2000–2020)
- Annual shrub cover for Ramona area.
- Trend layers: slope (% change per year) and p-value.
- Used for within/outside perimeter comparisons.
(MRLC/USGS, 2020).
For H1.2: NDVI Vegetation Health
- NASA MODIS NDVI (AppEEARS, 2000–2020)
- Spatially clipped NDVI data for southern California.
- Supports analysis of vegetation health inside and outside fire perimeters across key timepoints.
(NASA LP DAAC, 2023).
References
- CAL FIRE. (2003). Cedar Fire Incident Report.
- CAL FIRE. (2007). Witch Creek Fire Incident Report.
- Keeley, J. E., Fotheringham, C., & Mortiz, A., M. (2004). Lessons from the 2003 wildfires in southern California. https://moritzfirelab.org/wp-content/uploads/2016/01/keeley_etal_2004-2.pdf
- MRLC/USGS. (2020). RCMAP Shrub Cover Time Series.
- NASA LP DAAC. (2023). Moderate Resolution Imaging Spectroradiometer (MODIS) NDVI.
- NOAA National Centers for Environmental Information. (2025). Climate Data Record for Ramona, CA.
- Pourade, R. (1965). Gold in the Sun: The History of San Diego. San Diego Historical Society. Madrona Pub.
- Shipek, F. (1988). PUSHED INTO THE ROCKS, Southern Indian Land Tenure, 1769-1986. University of Nebraska Press.
Study Area
Before we can get to the fun analyses, I had to create a variety of boundaries for this project including those for Ramona, both fires, as well as buffer around these fires. Below you can see how these ended up plotting before we move onto the land cover changes, NDVI calculations and the Ramona climate data.
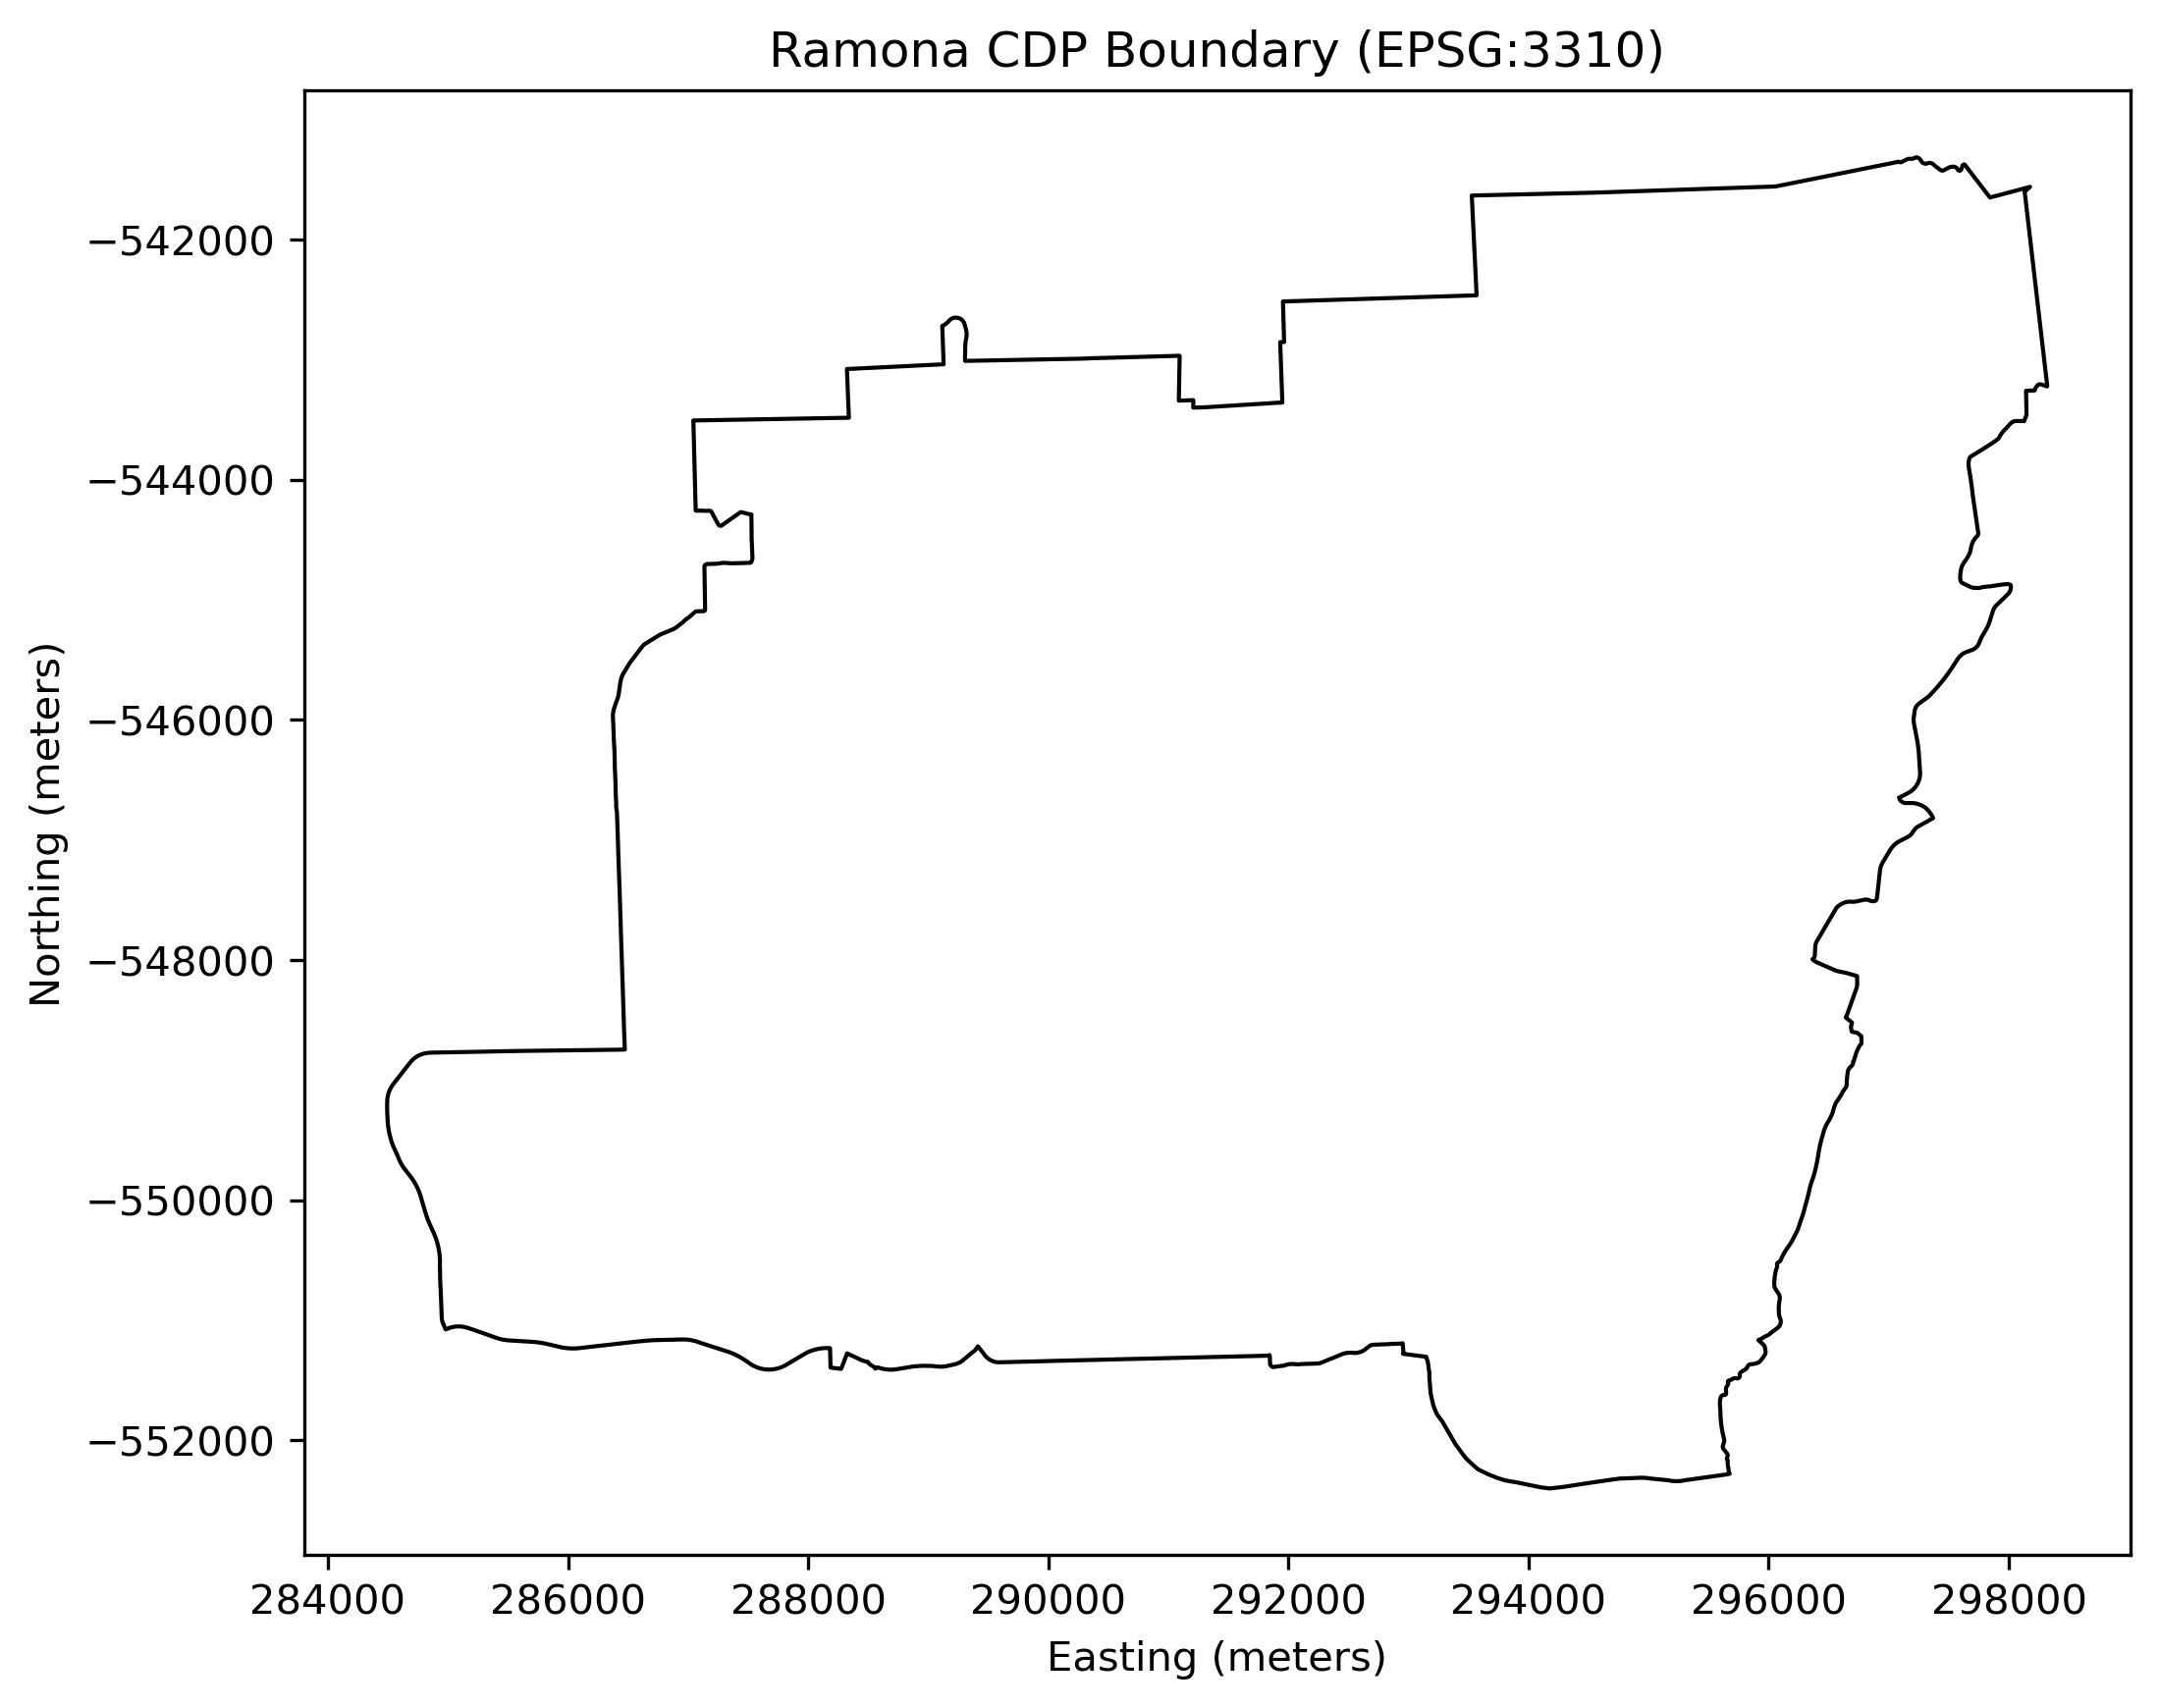
The analysis is centered on the Ramona Census Designated Place (CDP) boundary in San Diego County. I constructed a consistent spatial data pipeline using geopandas, rasterio, and xarray in EPSG:3310 (California Albers) to ensure all rasters and vector layers align correctly. For all boundary axes, these will be northing (meters) for the y axis and easting (meters) for the x axis.
Fire Perimeters & Buffer Zones
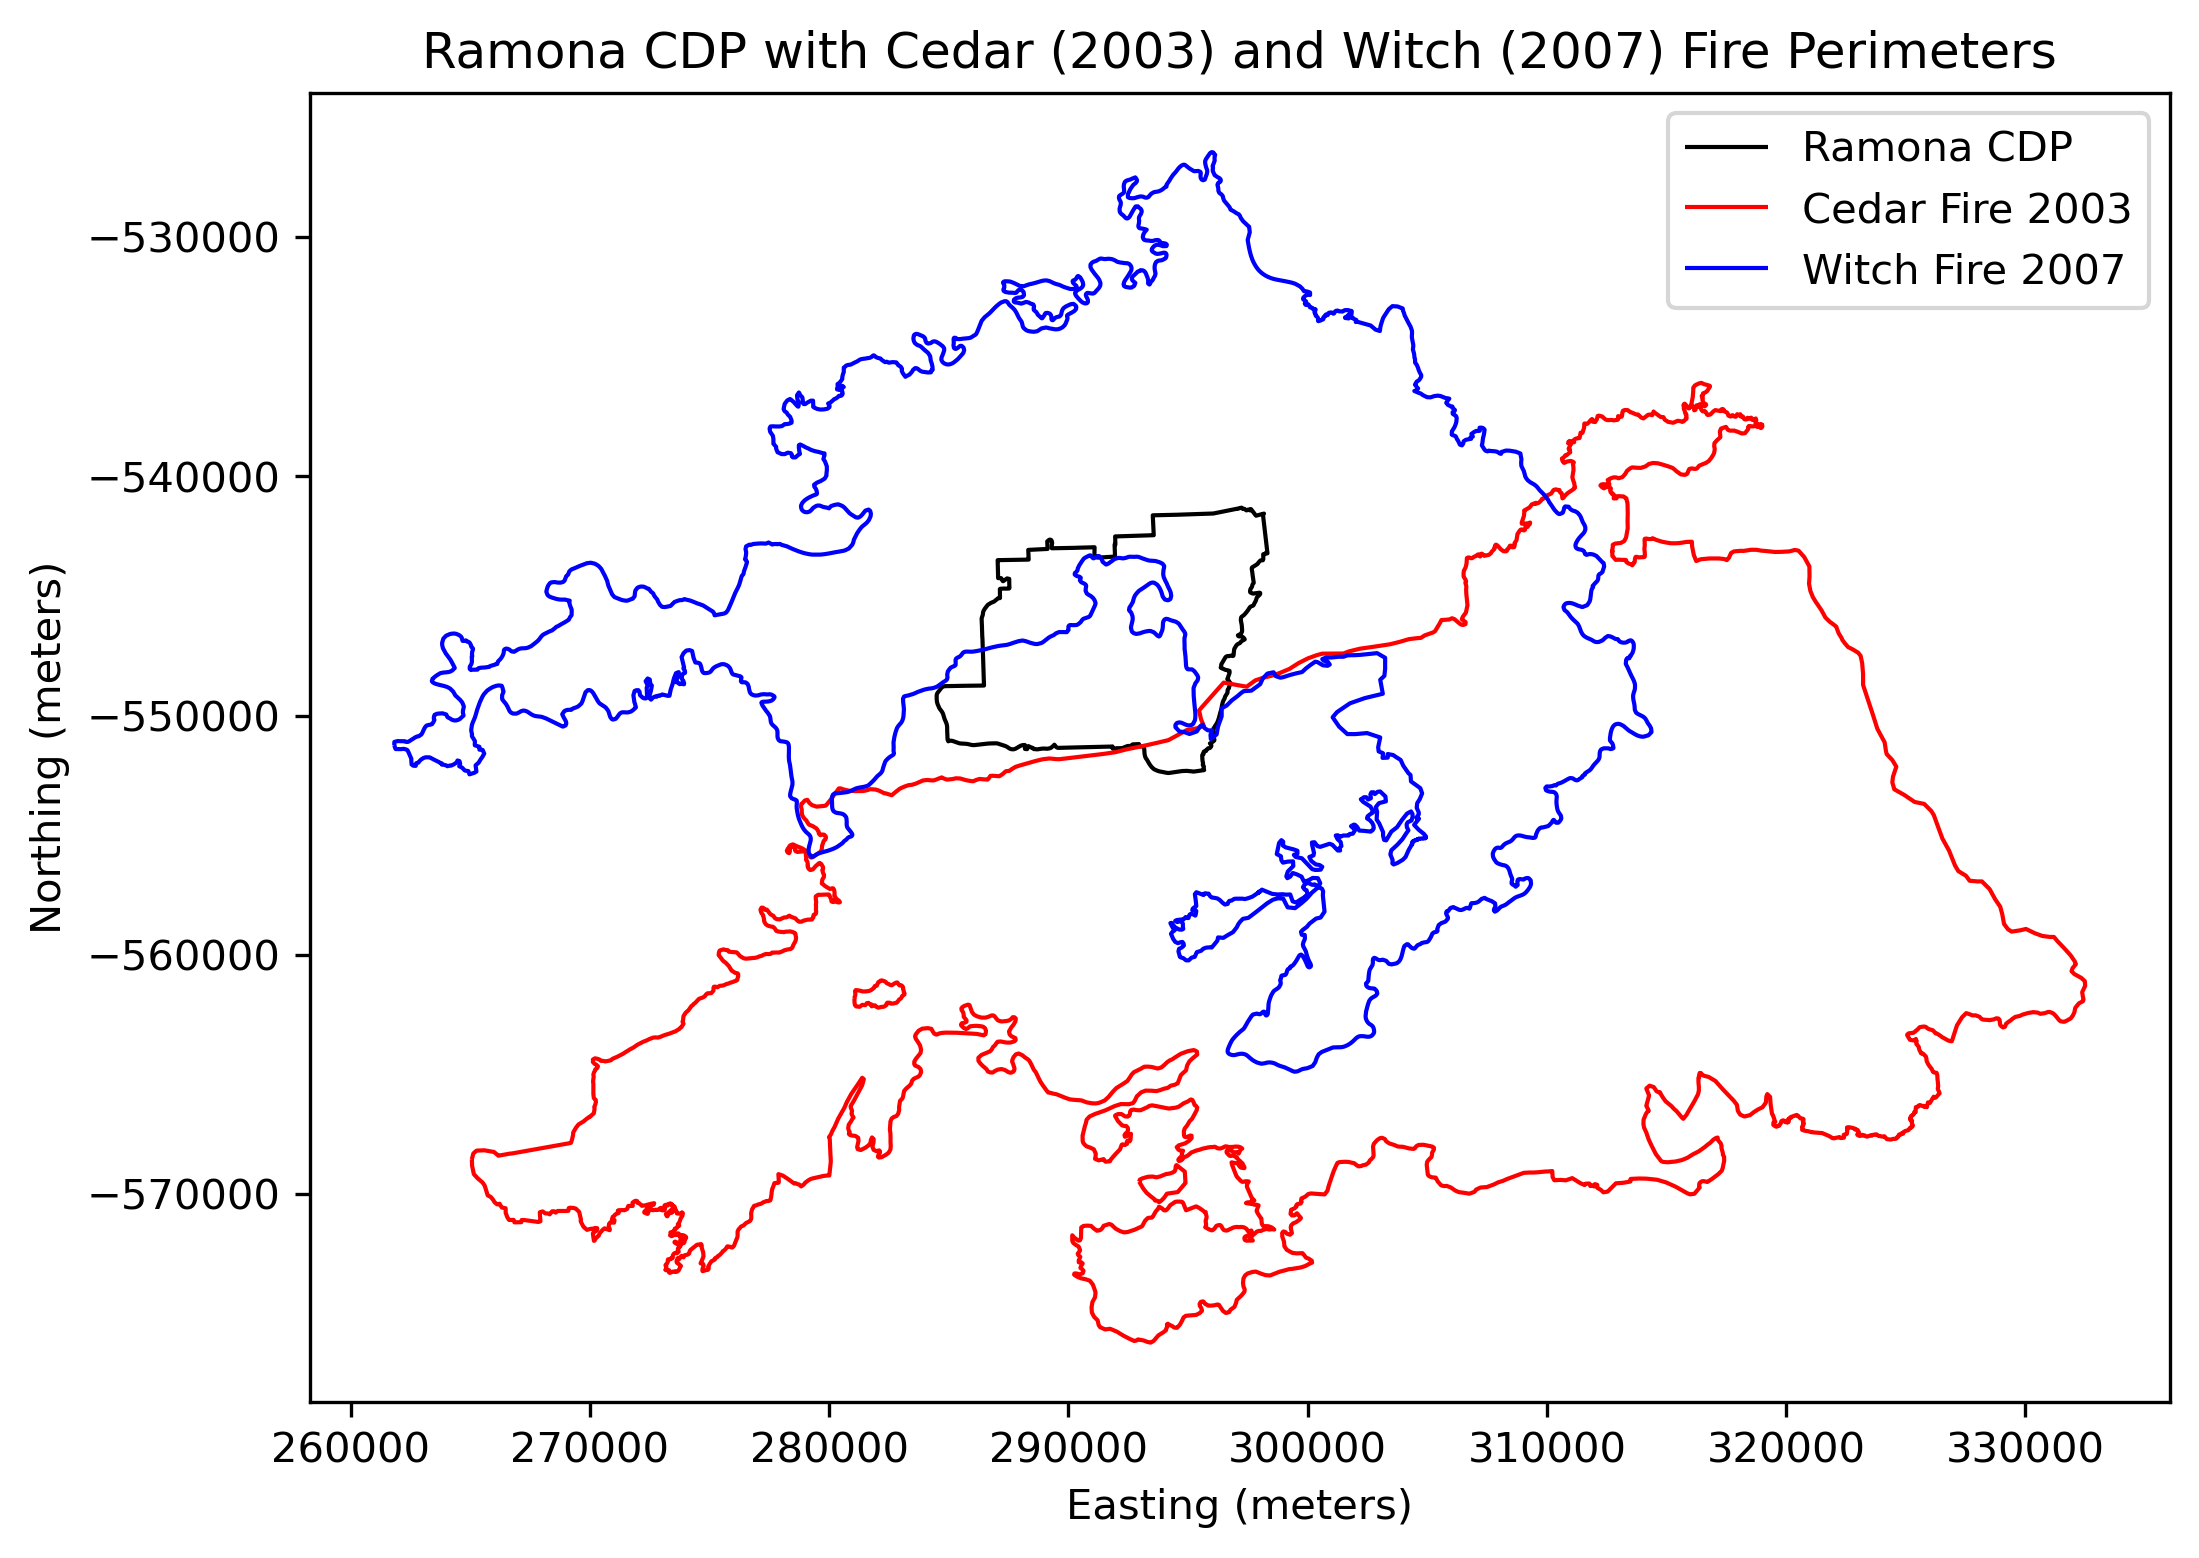
To evaluate differential recovery, I created inside-vs-outside comparisons using:
- Cedar Fire perimeter (2003)
- Witch Fire perimeter (2007)
- A 0–4 km buffer around each perimeter representing “outside” comparison zones
- Ring geometries representing only the buffer area (buffer minus interior fire scar)
These geometries were used to clip both shrub cover and NDVI data while preserving consistent CRS and extent. Here you can see how the fires overlap with Ramona, creating a “ring of fire.”
Now we can see the fun analyses! Lets check out the shrub cover change, NDVI change and climate in Ramona!
RCMAP Shrub Cover (1998–2024)
Using RCMAP’s time-series shrub cover product, I calculated:
- Percent shrub cover inside vs. outside each fire boundary
- Pixel distributions by east vs. west sectors
- Longitudinal trajectories of shrub recovery after each fire
Key Findings
- Shrub cover sharply declines in the years immediately following both fires, with recovery taking well over a decade or more.
- East–west comparisons reveal strong spatial heterogeneity for the Cedar fire but not so much for the Witch fire.
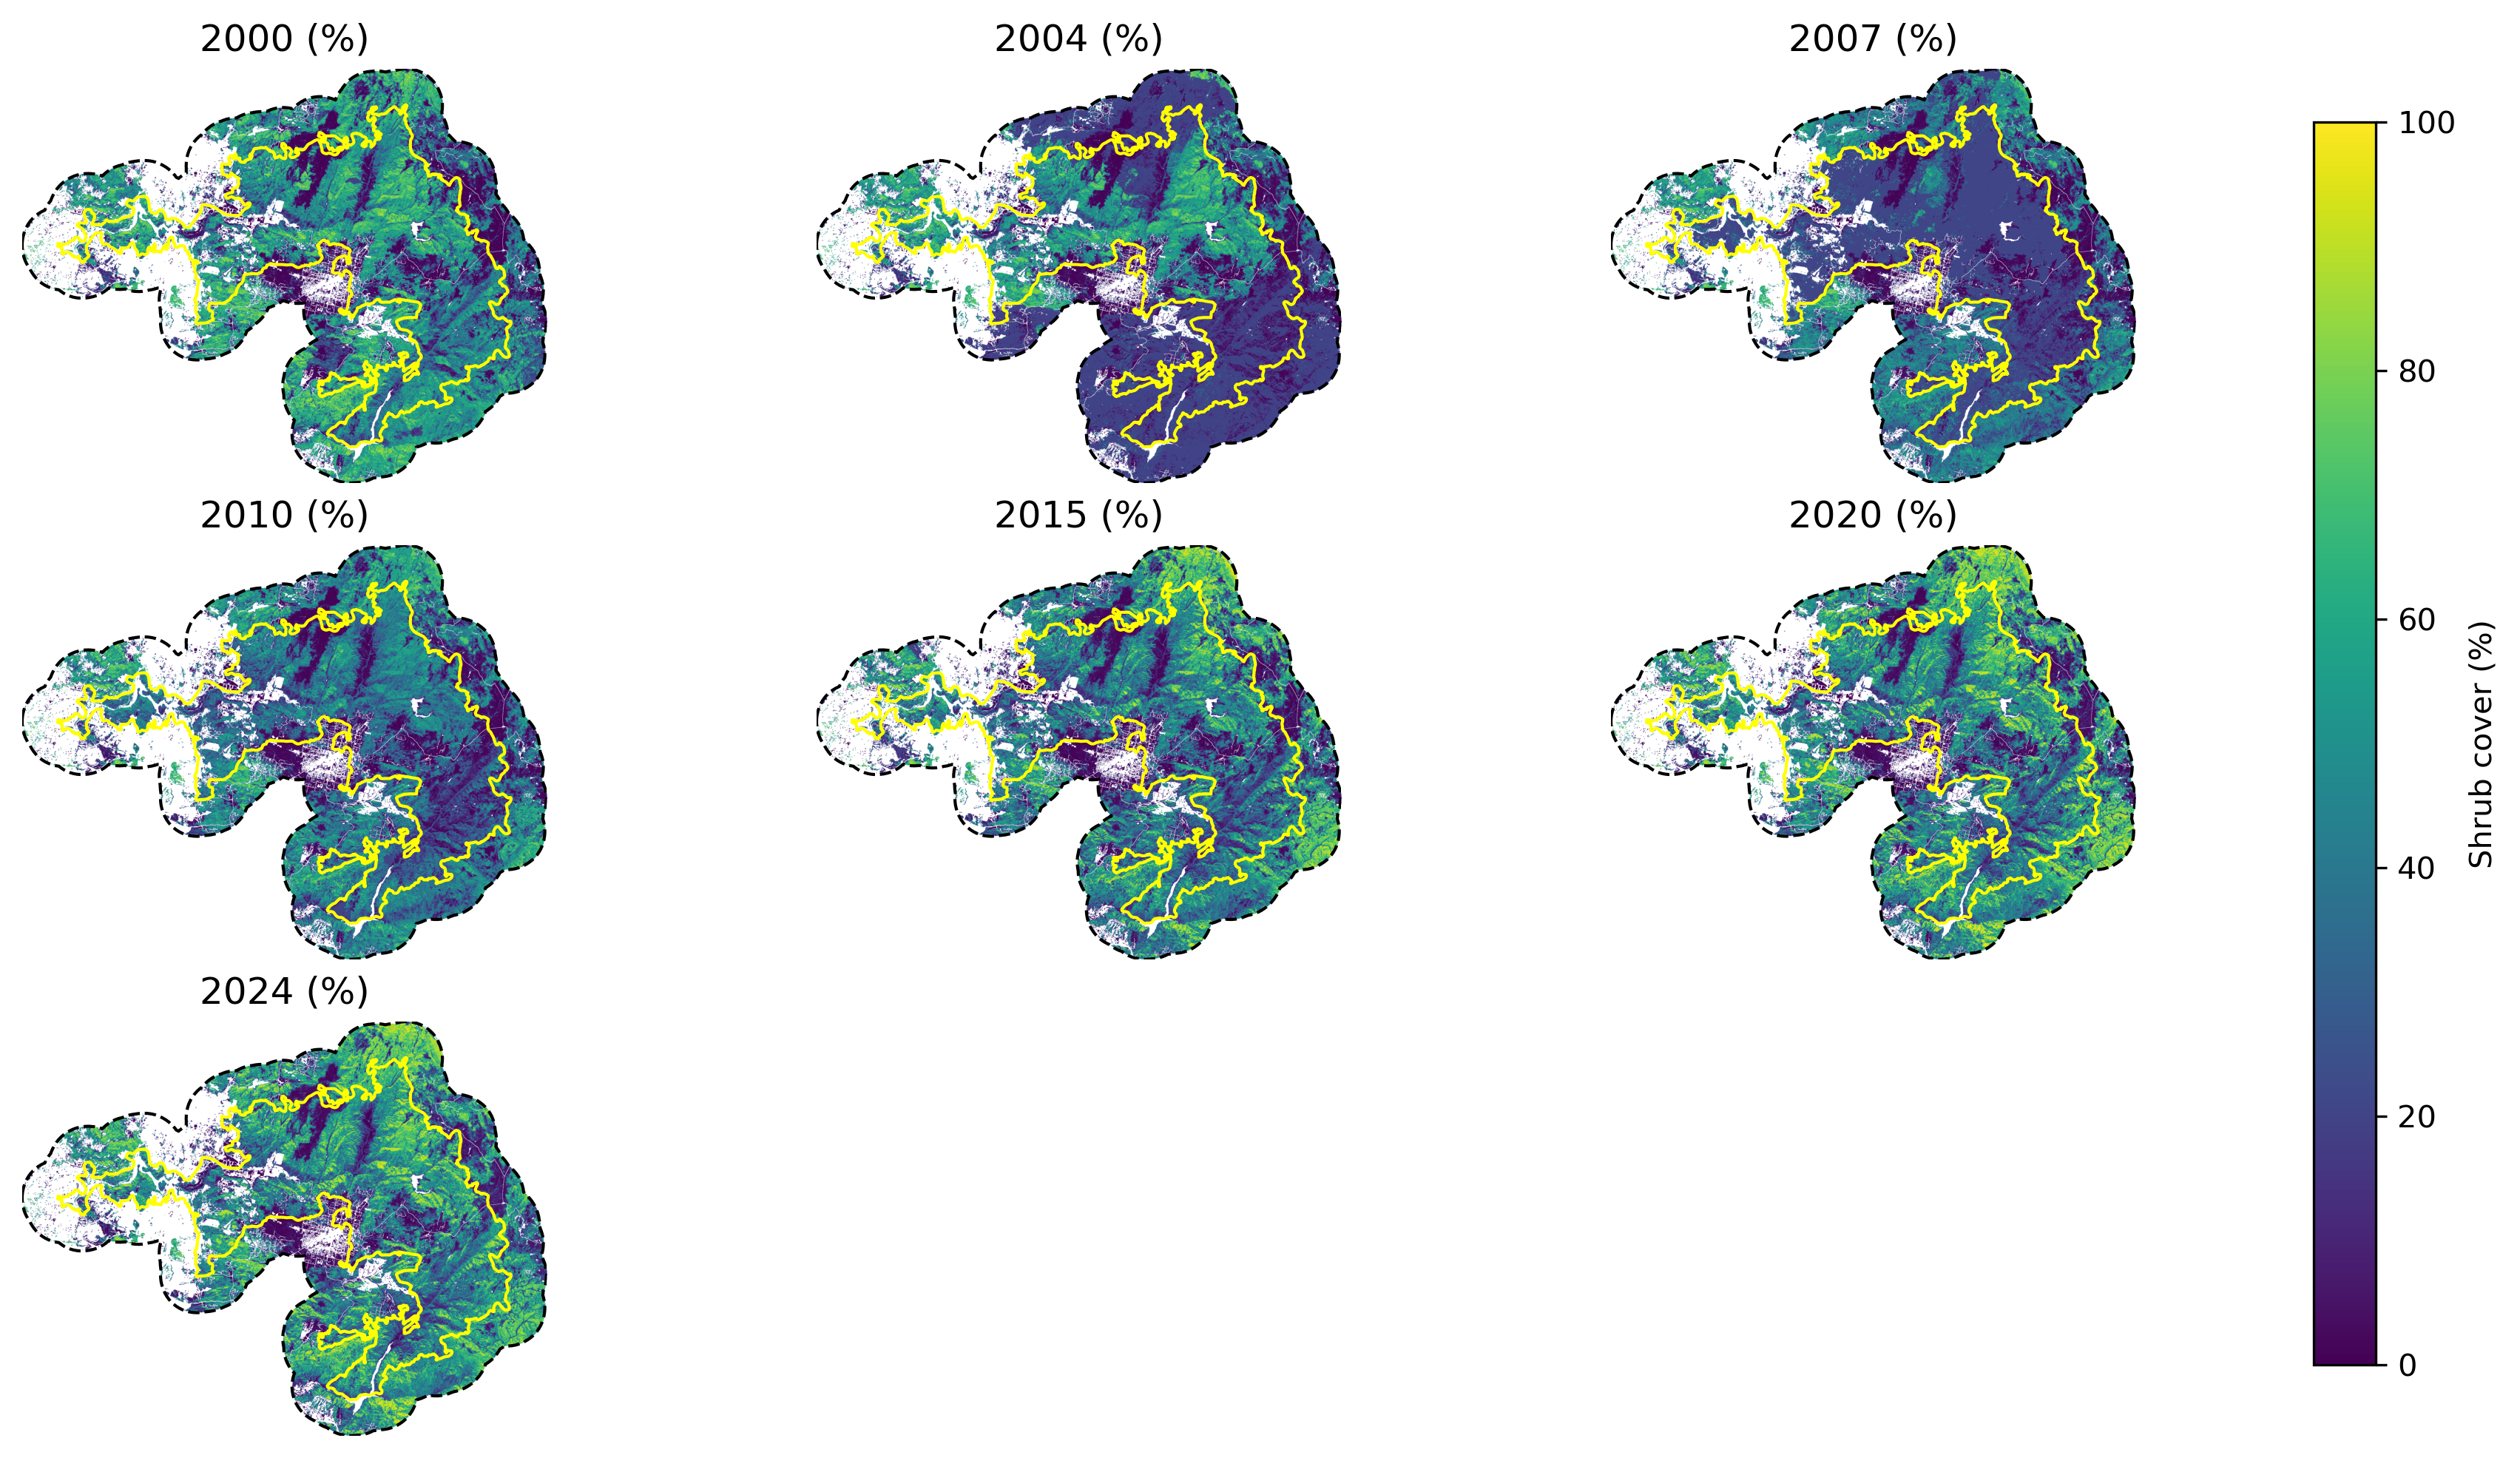
Cedar fire shrub cover changes between 2000 and 2020
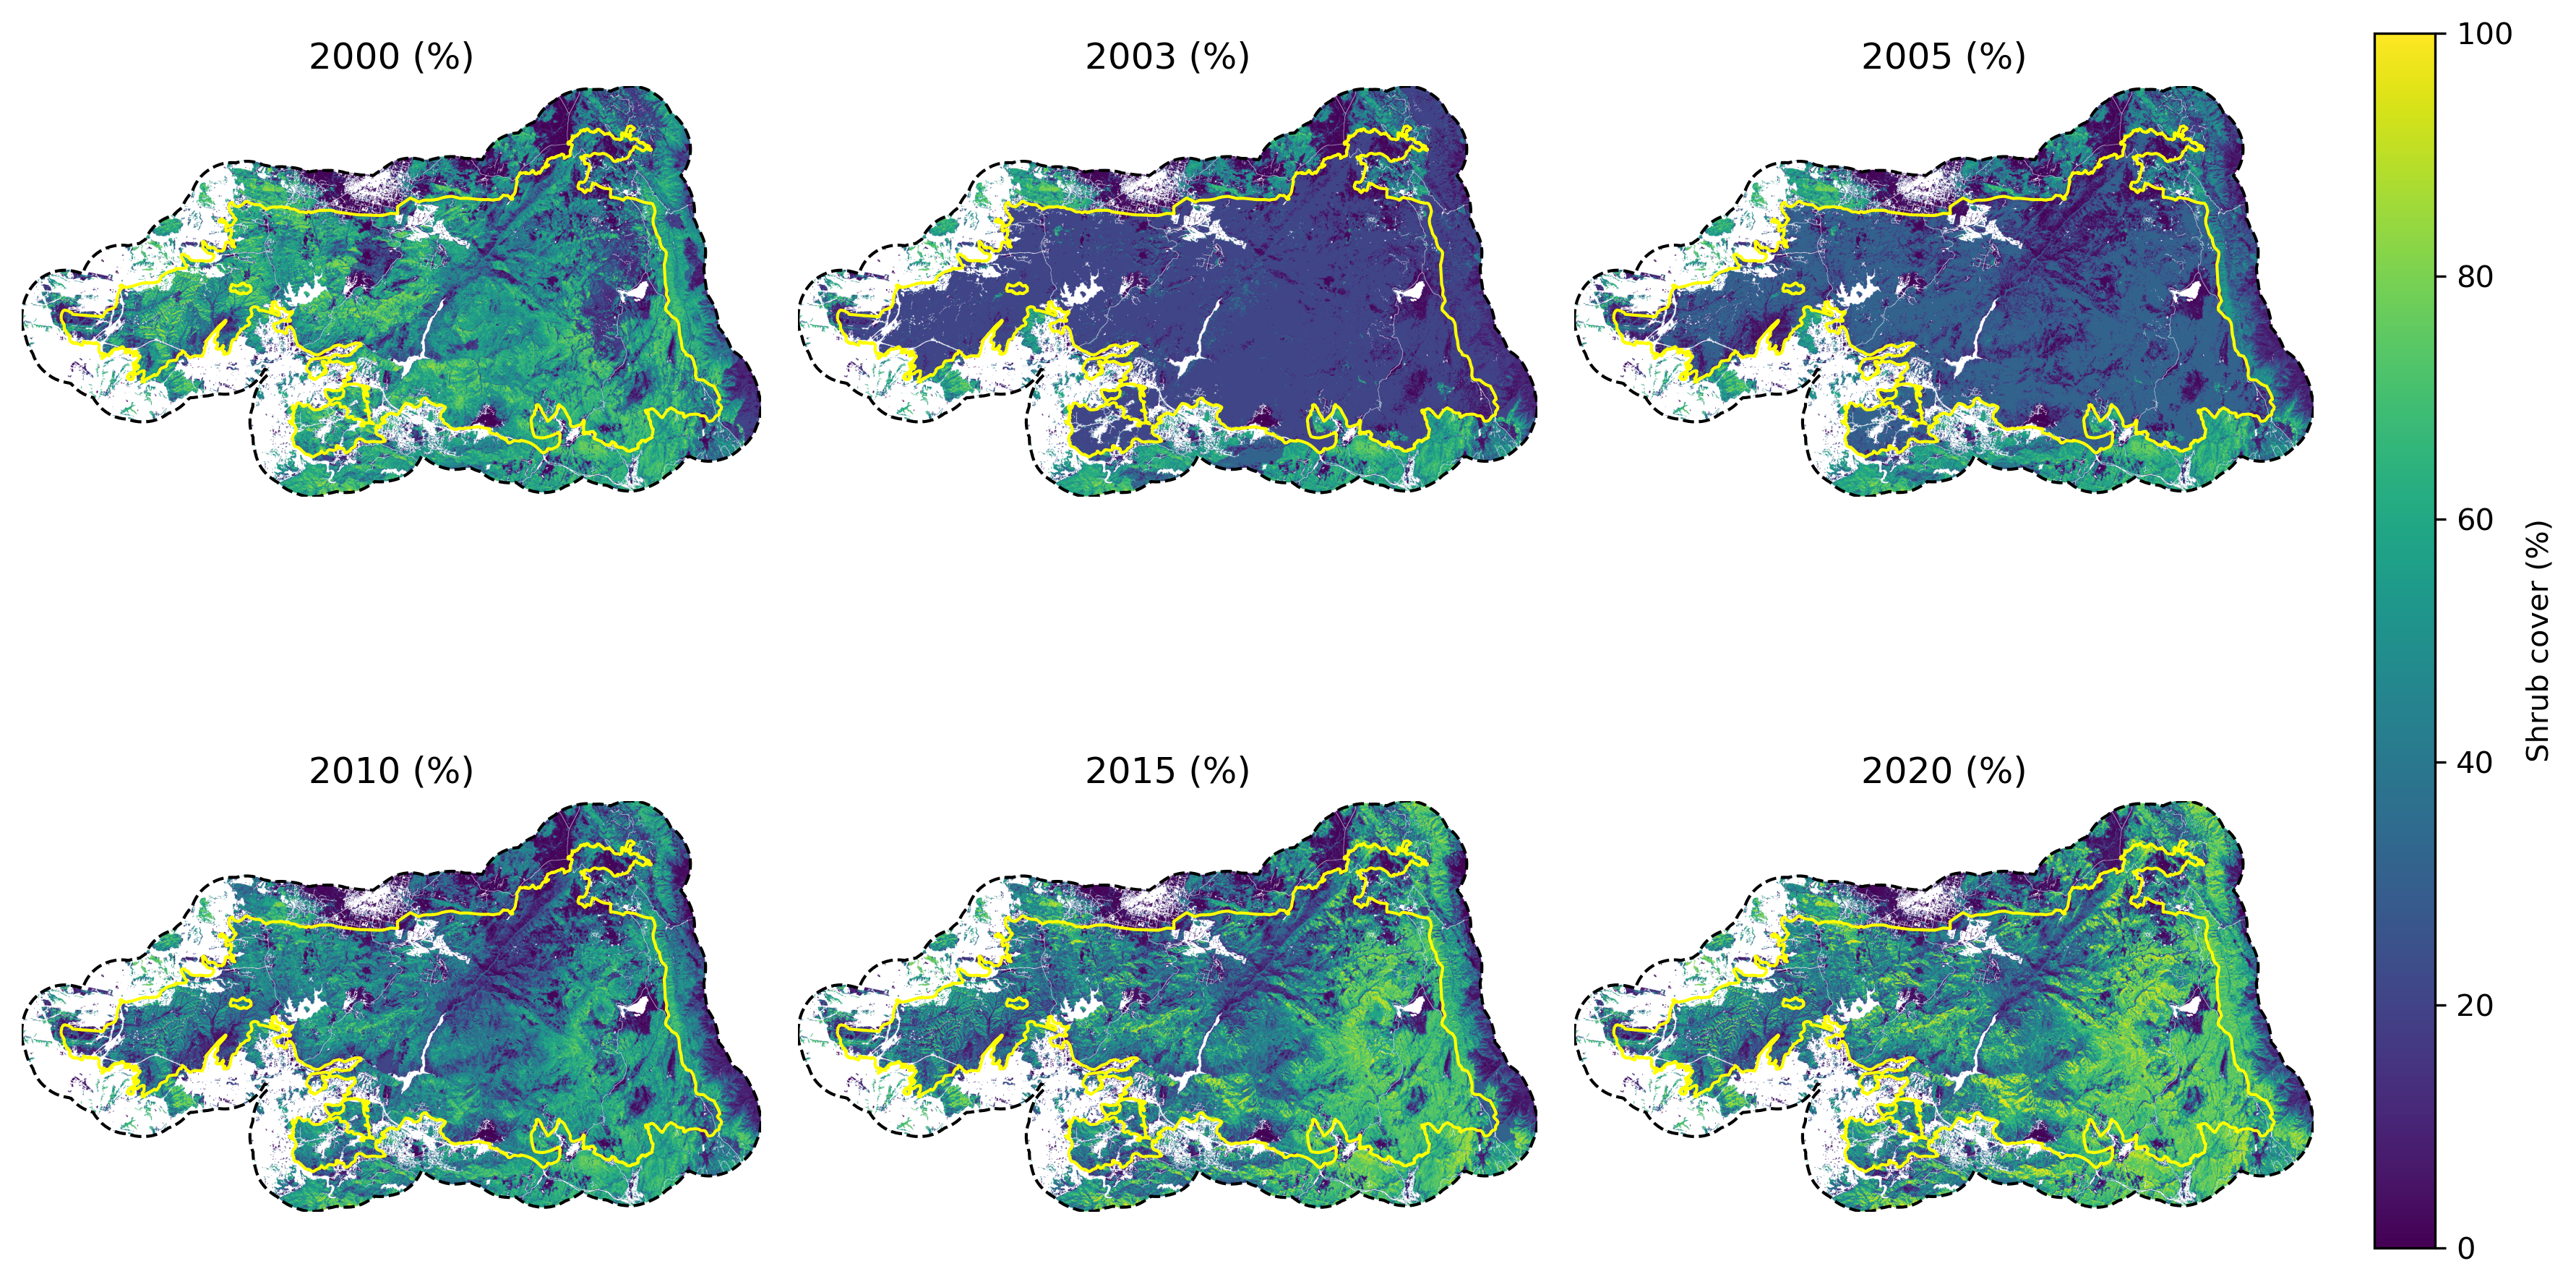 You will notice in the plotted shrub cover above, which ranges from 0-100 that there seems to be a different recover pattern emerging between the west and east sides of the burn area. In the buffer area (0-4km) we also see some white space which is just urban areas (so no shrub values). Between the plotted years, looking at 2000 and 2020, the post-burn area still has not recovered to pre-burn levels. We can prove this with with a difference map, which you can see below.
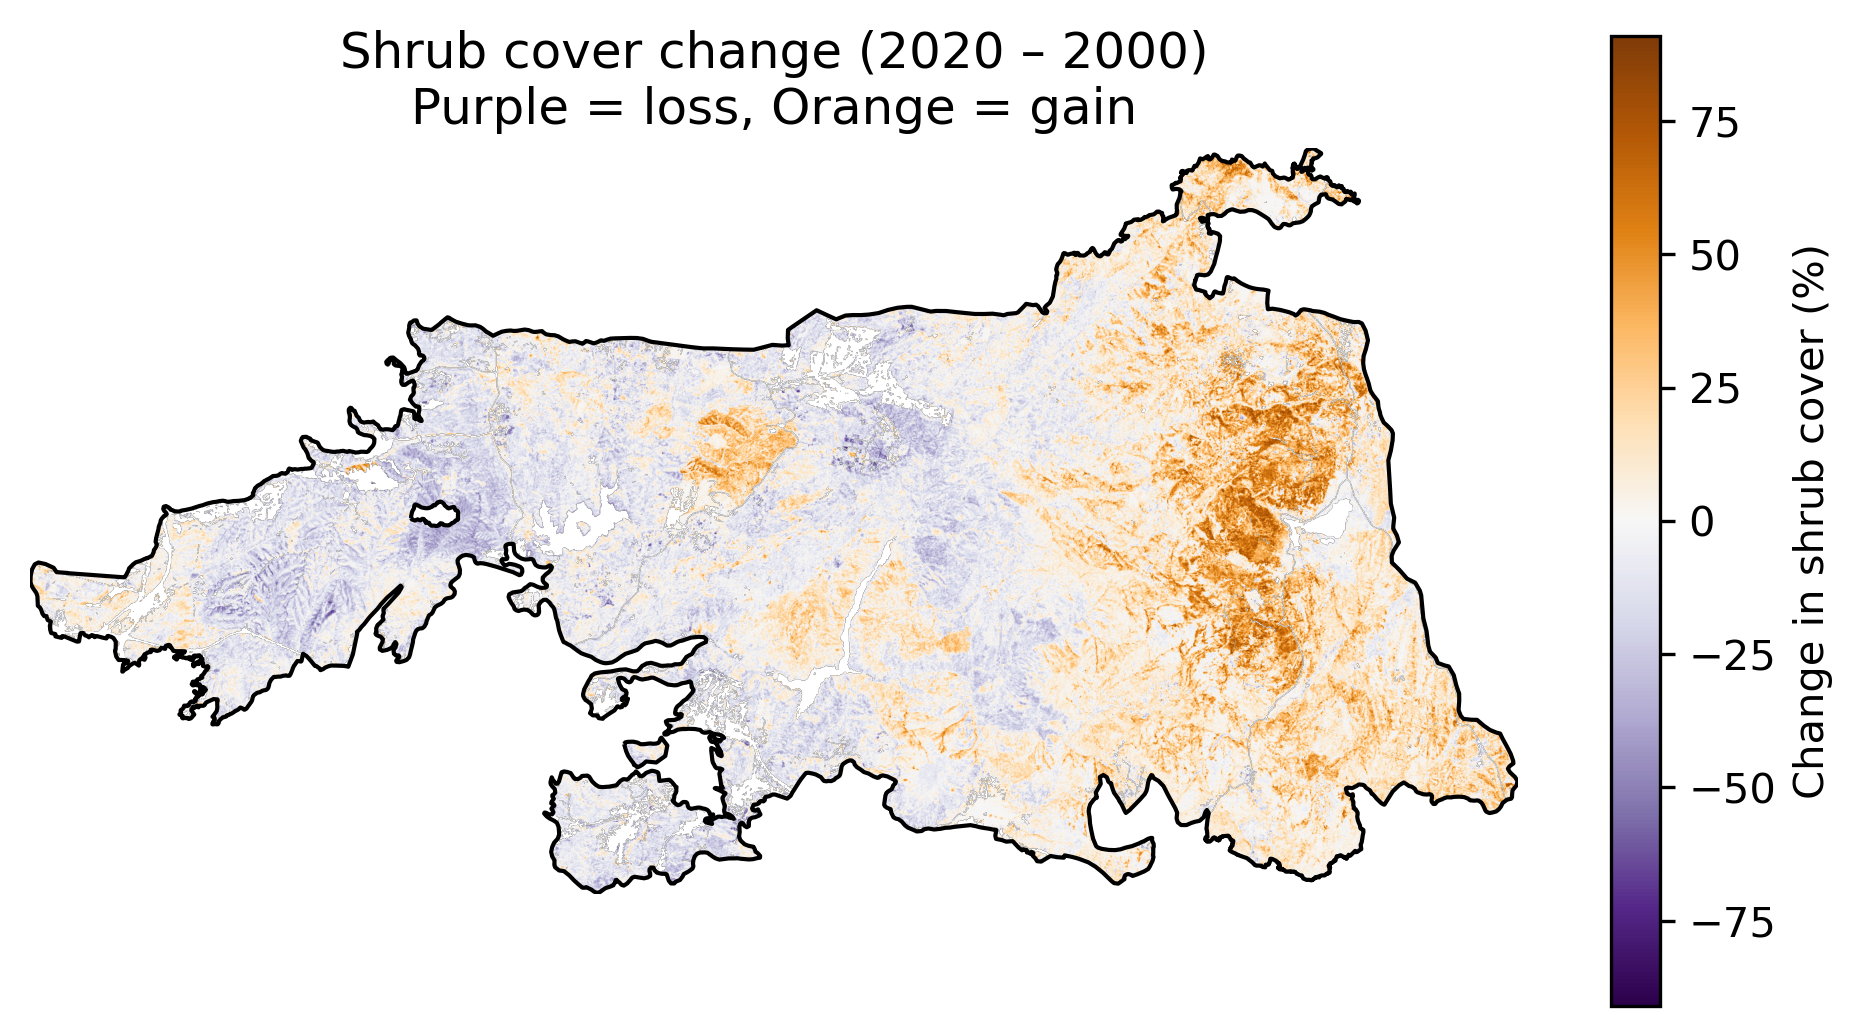 Here we see that there was a lot of shrub gains (orange) on the east side of the burn area, but we have had distinct shrub loss in the western part of the burn area. These differences make sense since the mean shrub change over this period of time was a minimum of negative/loss 82 percent and positive/gain 92 percent.
To ensure that what we see is statistically significant we can calculate cohen’s d which helps measure the effect size. Cohen’s d quantifies the standardized difference between two group means, essentially telling you how many standard deviations separate the average of two groups. Fortunately, we are using means here! Cohen’s d ranges from 0 to 2. It helps determine the practical significance of findings, indicating whether a difference is small (around 0.2), medium (around 0.5), or large (around 0.8) or more. For the Cedar fire the cohen’s d was 0.8! So a large difference (we will come back to this).
Witch fire shrub cover changes between 2000 and 2020
 With the Witch fire we do not see a extreme east-west divide in terms of recovery and we know this beyond just looking at the shrub cover changes in the plotted maps above. Just like the Cedar fire if we look at the shrub difference between 2000 and 2020, we get the following plot:
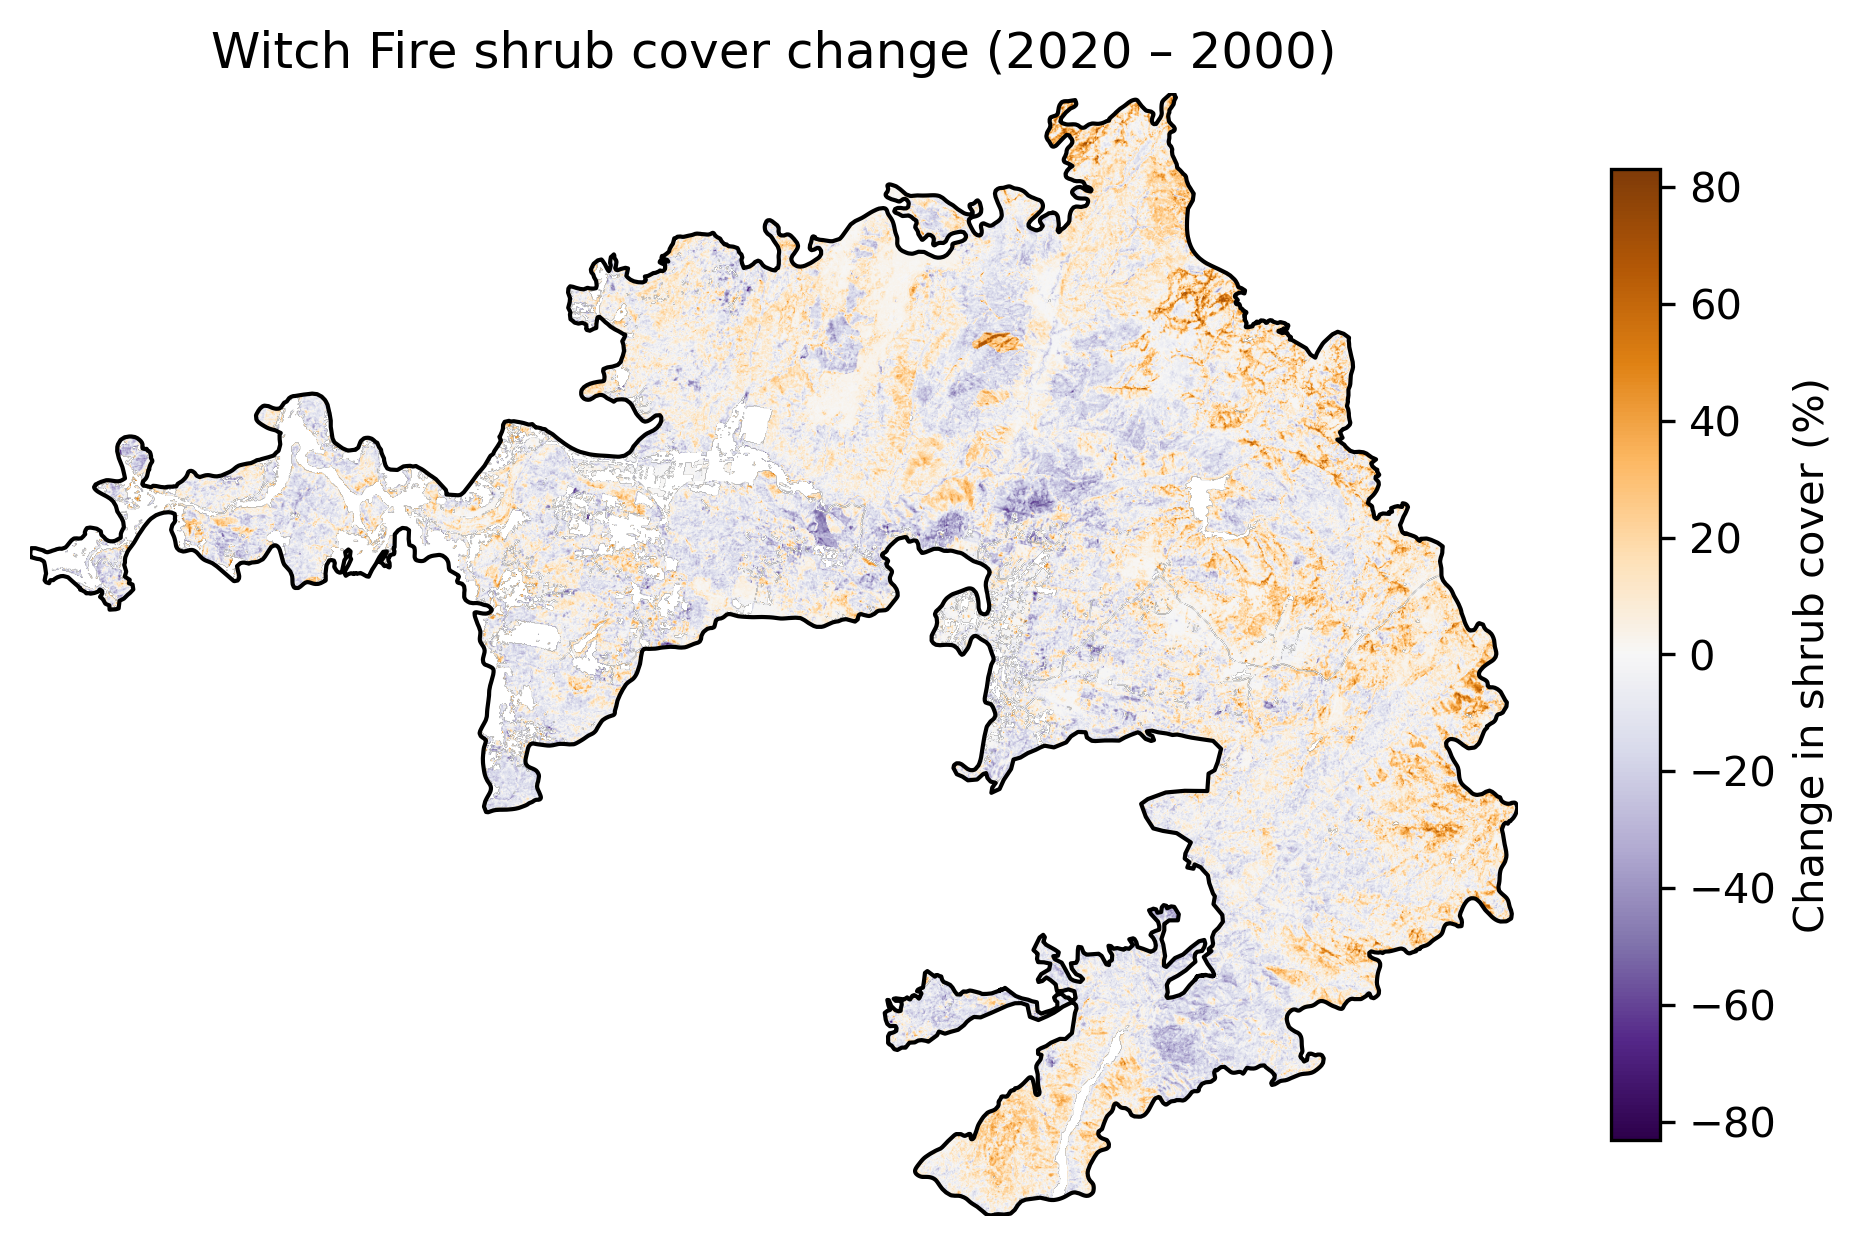 Here we see that the map is much more uniform in terms of shrub change in this 20 years period. However, we can check if this is the case by calculating cohen’s d for the Witch fire, which was only 0.2, meaning there are no singificant differences in recovery between the east and west burn areas. If you want to learn more about how we differentiate the east and west sides of these fires, check out the landcover notebooks linked at the top of this post.
So what does the shrub landcover tell us?
Ramonians were right: after the Cedar fire areas did not recover:
Although shrub cover dropped to near-zero across the entire Cedar Fire footprint in 2003 and remained extremely low in 2005—indicating that both the eastern and western portions of the landscape experienced similarly severe shrub loss—the subsequent recovery patterns diverged sharply. By 2020, the eastern half showed strong shrub regeneration and in many areas exceeded pre-fire levels, while the western half recovered much more slowly and in places exhibited persistent shrub loss. This difference is quantified by a Cohen’s d of 0.80, a large effect size, indicating that the east and west sides of the fire scar now represent distinct ecological trajectories rather than variations around a shared recovery pattern. The result suggests that even though both regions were equally impacted by the initial disturbance, differences in burn severity, microclimate, species composition, or post-fire disturbance produced a long-term bifurcation in vegetation dynamics.
NDVI Greenness Recovery (AppEEARS MODIS Data)
To capture vegetation health, I extracted April–June NDVI for pre-fire, post-fire, and long-term recovery years. Unlike with the shrubs we see a much more complex story with the vegetation health. See the Cedar and Witch NDVI maps below for our interested years. Remember that NDVI scales between [0,1]. Unlike with the shrub cover maps where we can exclude non-shrub areas, for NDVI even urban areas have some level of reflectance. You will see that the original urban areas in the buffer zone for these NDVI maps essentially merge with the surrounding area. Just keep in mind that we do have urban features in the buffer zone.
Cedar fire NDVI changes between 2000 and 2020
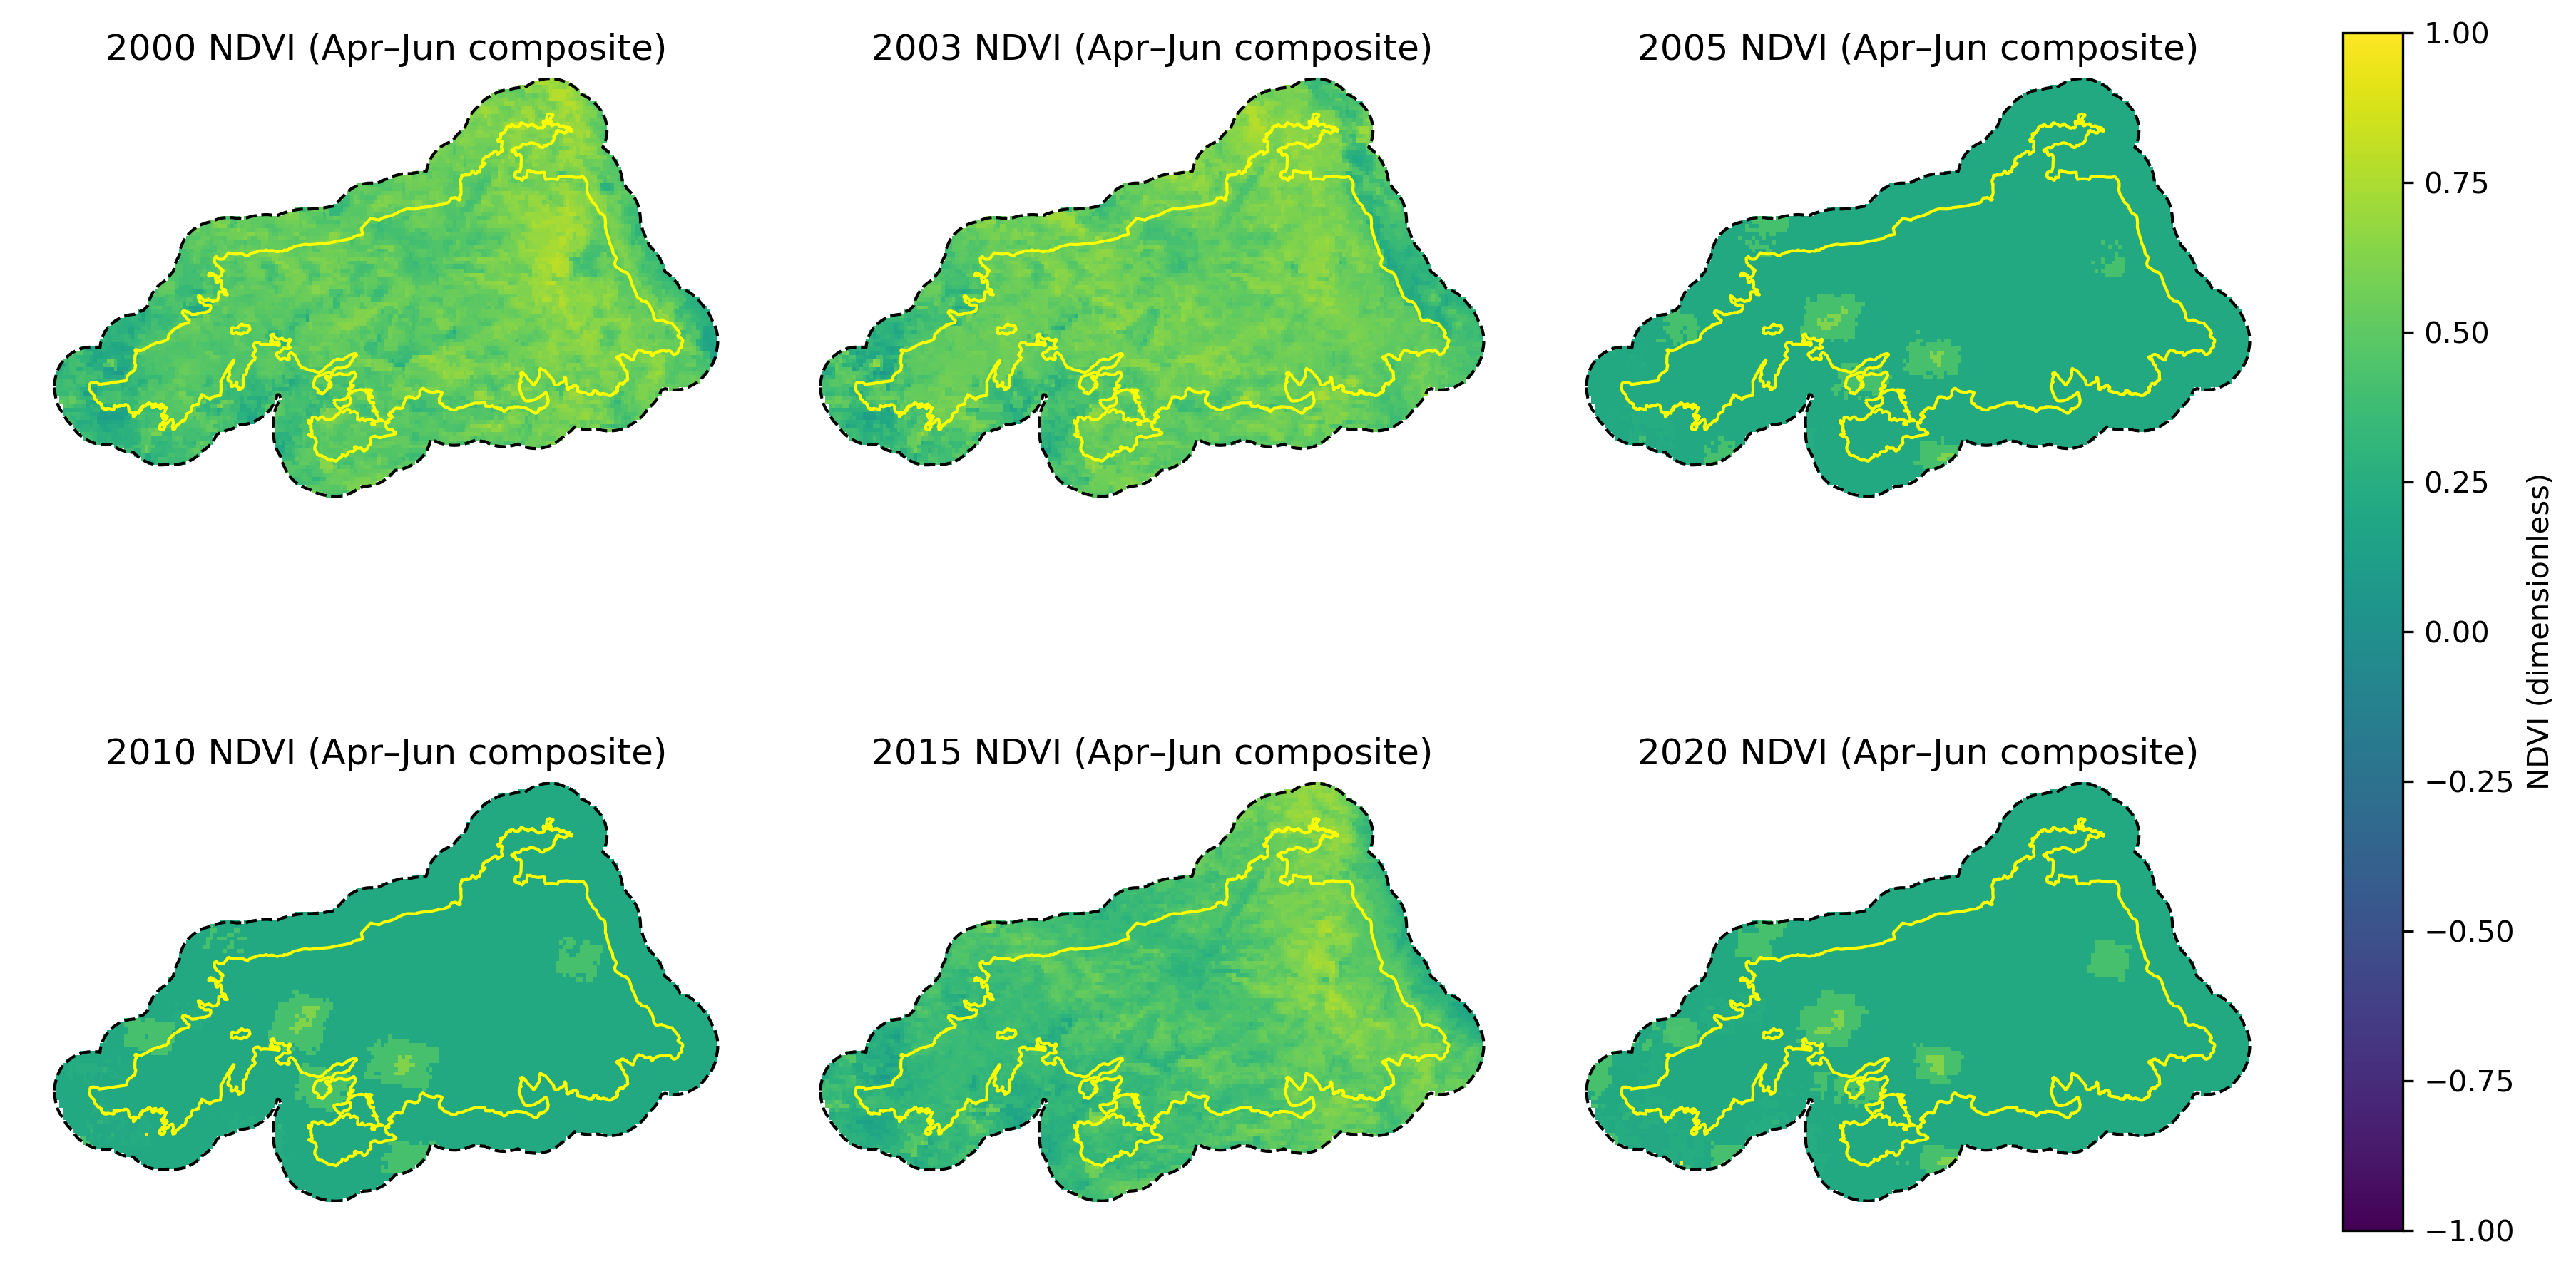
NDVI and the Cedar Fire
Unlike our shrub cover maps which showed clear differences, here we see that the NDVI value for April-June changes a lot between our selected years. While shrub coverage helped us see where shrub is, these maps indicate tha the shrub is under similar duress both during and outside the fire event. Likely the shrub is responding to the drought conditions that plague Southern California. As a result, our NDVI data doesn’t actually help us understand change pre and post fire, but issues with percipitation. We would need to also plot precip data which is beyond the scope of this project to see if the low NDVI years correlate with low rain fall (e.g. years 2005, 2010 and 2020). Also note that because the peak time for greening is April through June, our 2003 map does not show the effects of the fire.
Witch fire NDVI changes between 2000 and 2020
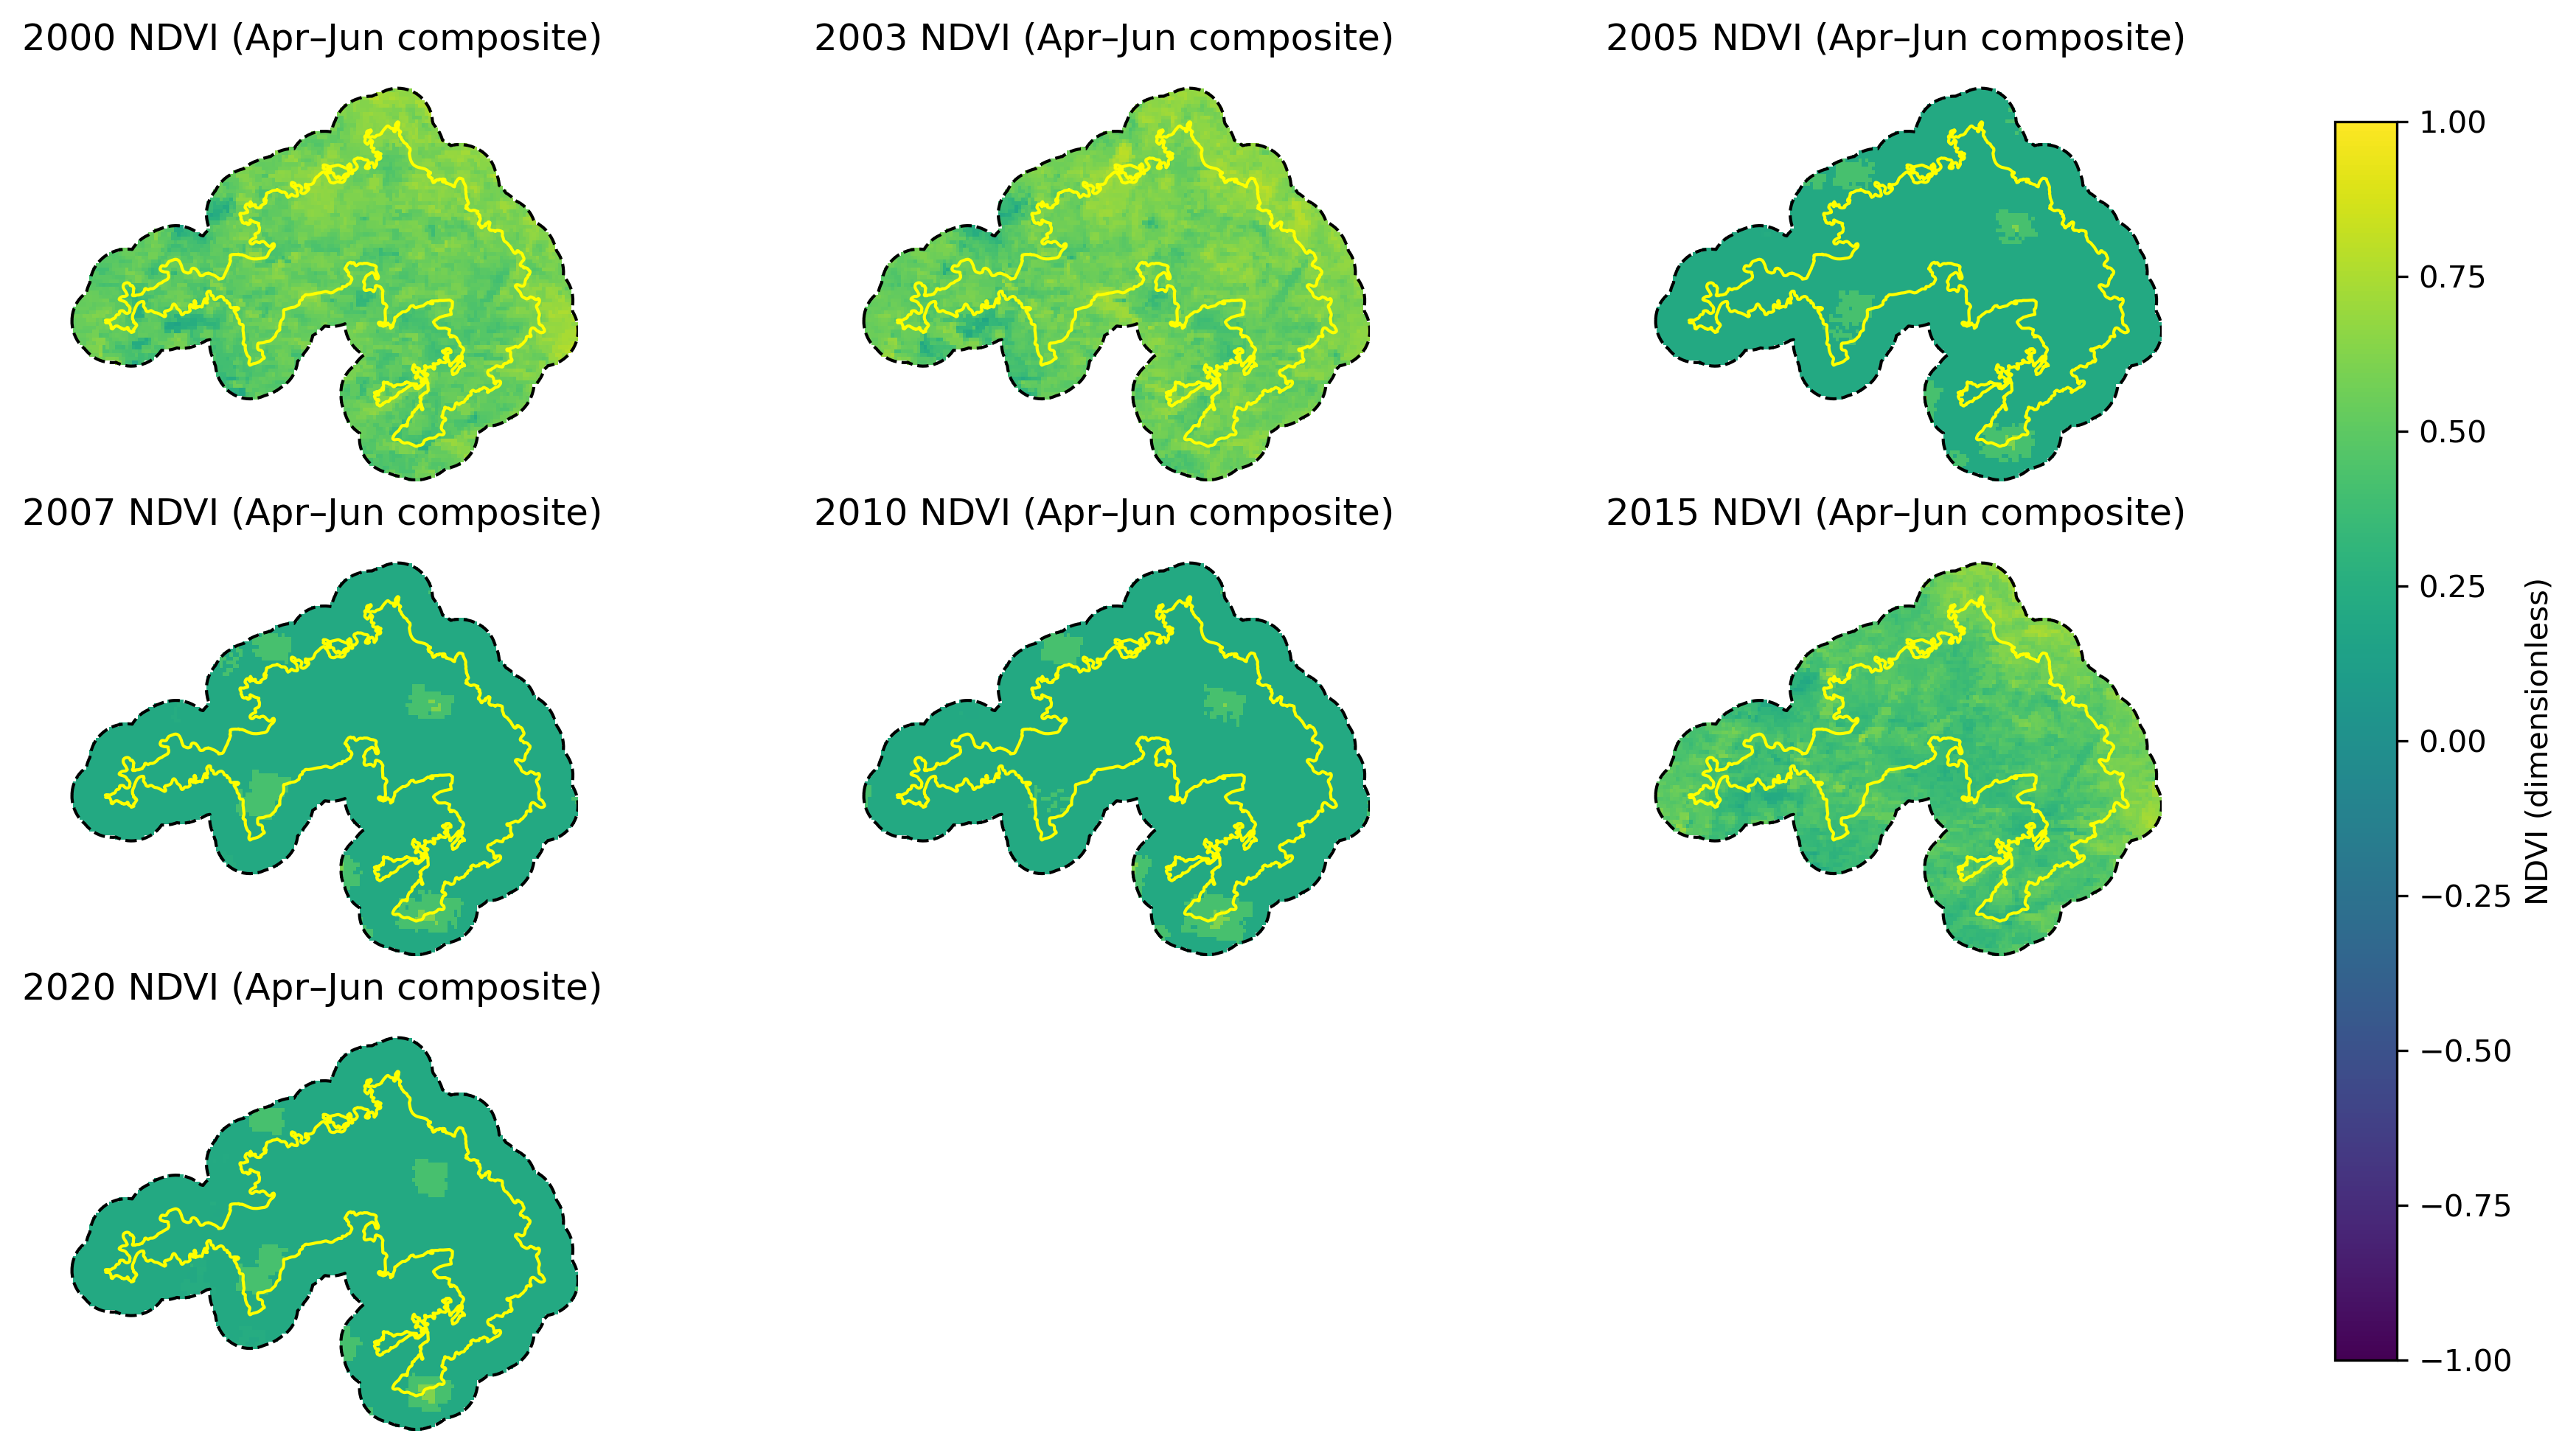
NDVI and the Witch Fire
We see similar patterns here like we did with the Cedar fire. However, unlike with the Cedar maps, in 2007 the shrub was already distressed prior to the Witch fire. Interestingly we see the same distrubance in 2005, 2010 and 2020. More to investigate in the future!
Climate Context: Ramona Temperature Trends (1998–2025)
Because vegetation recovery is tied to climate, I computed annual minimum and maximum temperature trends. In my analysis we see that Ramona is getting much hotter during the day and warmer during the night.
Temperature Trends in Ramona, CA (1998–2025)
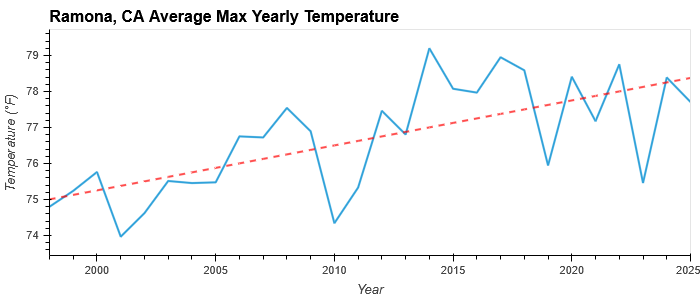
Analysis of annual maximum and minimum temperatures from the NOAA NCEI Ramona Airport station shows clear evidence of warming over the past 25 years. Both daytime highs (TMAX) and nighttime lows (TMIN) have increased, although at different rates. In the plotted trend below you can see we are increasing both during the day and at night. Here I have plotted the yearly average maximum temperatures and minimum temperatures:
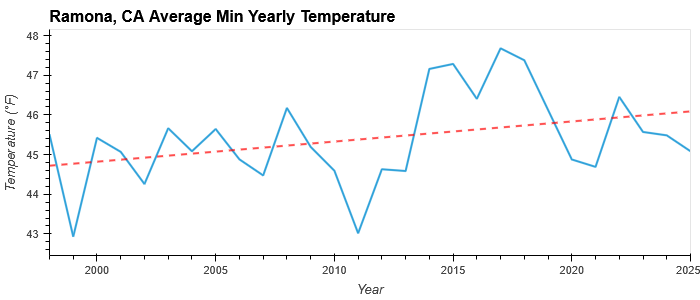
Nighttime temperatures in Ramona exhibit a modest but consistent upward trend, which means our cool nights are getting warmer.
- Warming rate: +0.0507 °F per year
- Equivalent to: +0.507 °F per decade
- R²: 0.129
The relatively low R² indicates greater year-to-year variability, but the long-term trend still points toward steady warming. Increasing minimum temperatures reflect reduced nighttime cooling, and perhaps broader issues of climate change. If we take our yearly warming rate (0.0507) and multiply it by the number of years (27), the (modeled) minimum temperature increased by 1.37 °F.
Daytime temperatures show a stronger and more statistically robust increase, which means our hot days are getting hotter.
- Warming rate: +0.1250 °F per year
- Equivalent to: +1.2496 °F per decade
- R²: 0.450
The higher R² demonstrates a clearer linear warming pattern in daytime highs, consistent with observed regional heat intensification in inland Southern California. The other thing of note, is that Ramona is warming RAPIDLY. If we take our yearly warming rate (0.1250) and multiply it by the number of years (27), the (modeled) maximum temperature increased by 3.38 °F. That is very fast for a 27 year period.
Overall Implications on the Ramona Climate
Taken together, the results show that Ramona is warming, with:
- Faster increases in daytime maximum temperatures
- Steady but slower increases in nighttime minimum temperatures
- From 1998 to 2025, Ramona’s daytime high temperatures increased by about 3.4 °F, while nighttime minimum temperatures increased by about 1.4 °F.
These patterns have important implications for:
- Fire risk: hotter, drier afternoons increase ignition and spread potential (especially with Southern California’s Santa Ana winds)
- Ecosystem stress: vegetation faces higher evaporative demand (meaning the vegetation distress we see in the lower NDVI map years for Cedar and Witch likely correlate with increasing temperatures and rare rainfall. We would need to plot precipitation to be sure but that is outside the scope of this project.)
In the end what have we learned?
Revisting my questions from earlier we now know that:
- Climate Change Assumption –> Ramona is indeed warming,
- Vegetation in Ramona has not fully recovered from the 2003 Cedar Fire but recovery seems uniform for the 2007 Witch Fire,
- There are indeed Shrubland differences within vs. outside fire perimeters but for our NDVI analyses,
- We do not see clear differences within and outside the fire perimeters for both fires.
For the future we would need to plot other precipitation data to understand what is going on with NDVI.
Tools & Methods
This project is written in Python, using:
geopandas • rasterio • rioxarray • matplotlib • hvplot • numpy • pandas
All analysis was completed in VS Code with a structured notebook workflow
(e.g., 01_load_boundaries, 03_landcover, 04_inside_vs_outside, etc.).